Viewing dbt models in the Dagster UI
Once you finished everything from the previous sections, you’re ready to see your dbt models represented as assets! Here’s how you can find your models:
If you haven't yet, run
dagster devin your command line and then navigate to the asset graph in the UI.Expand the
defaultgroup in the asset graph.You should see your two dbt models,
stg_tripsandstg_zones, converted as assets within your Dagster project!If you don't see the dbt models, click Reload definitions to have Dagster reload the code location.
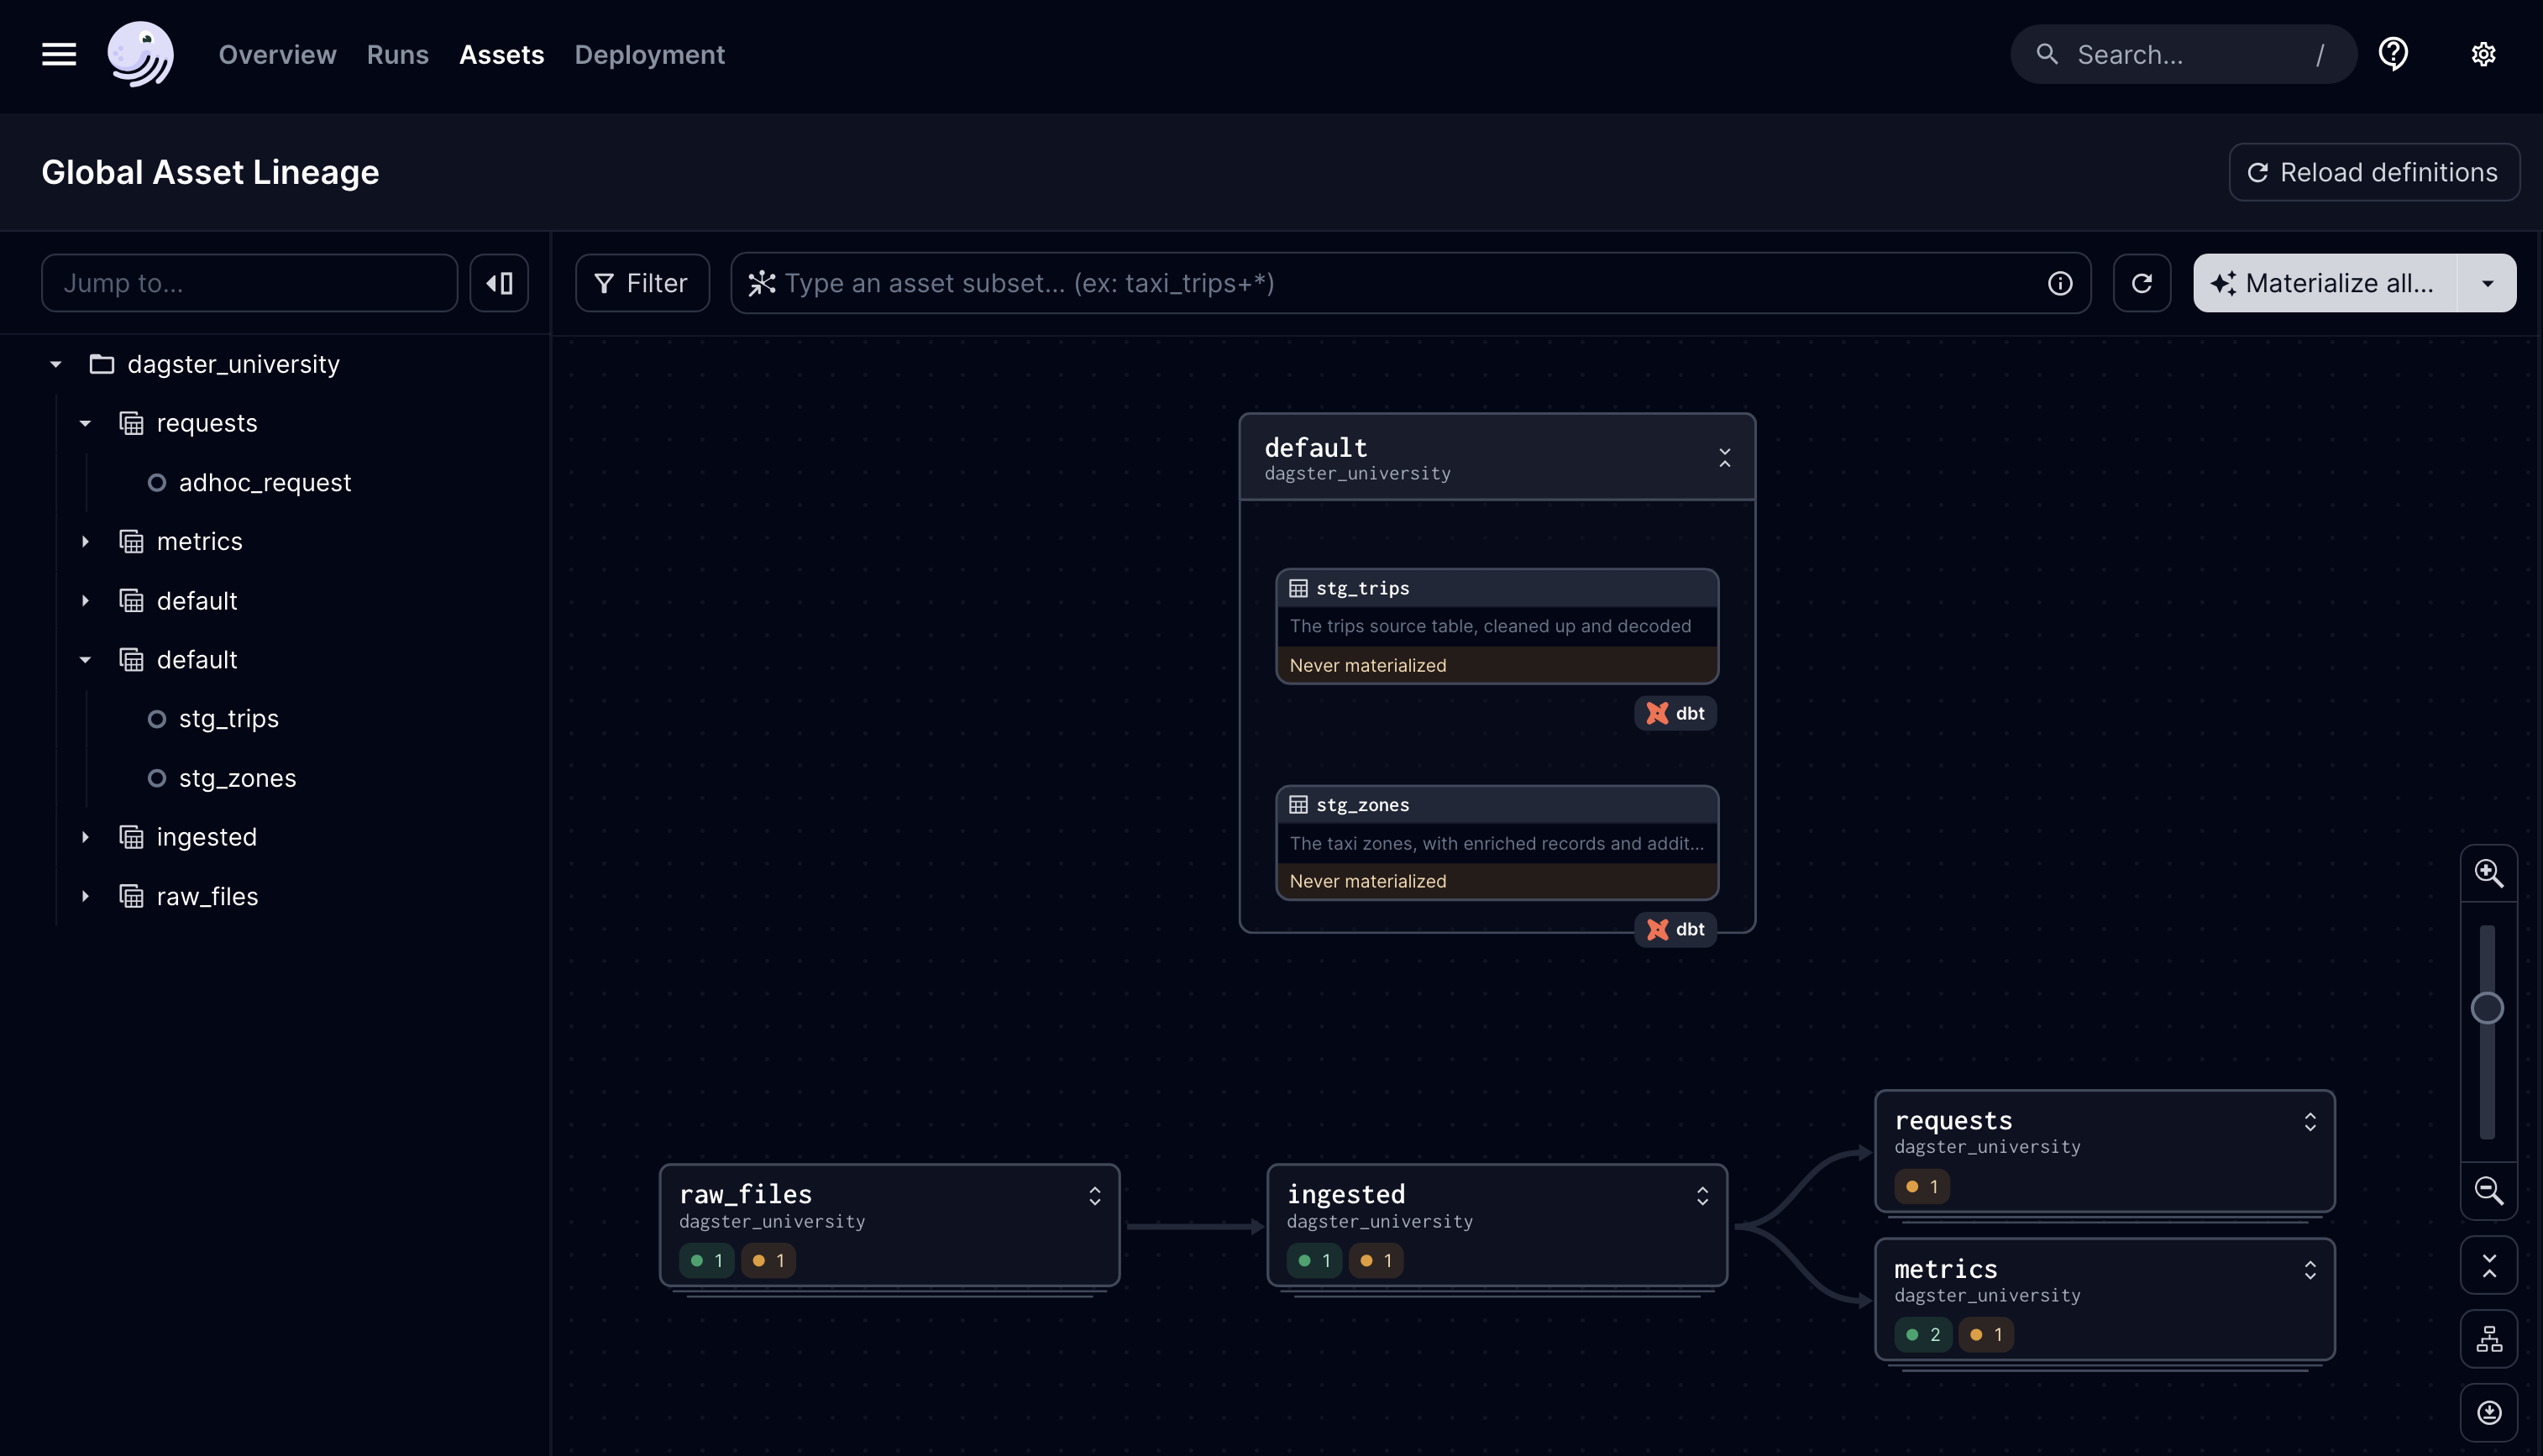
If you’re familiar with the Dagster metadata system, you’ll notice that the descriptions you defined for the dbt models in staging.yml are carried over as those for your dbt models. In this case, your stg_zones's description would say “The taxi zones, with enriched records and additional flags”.
And, of course, the orange dbt logo attached to the assets indicates that they are dbt models.
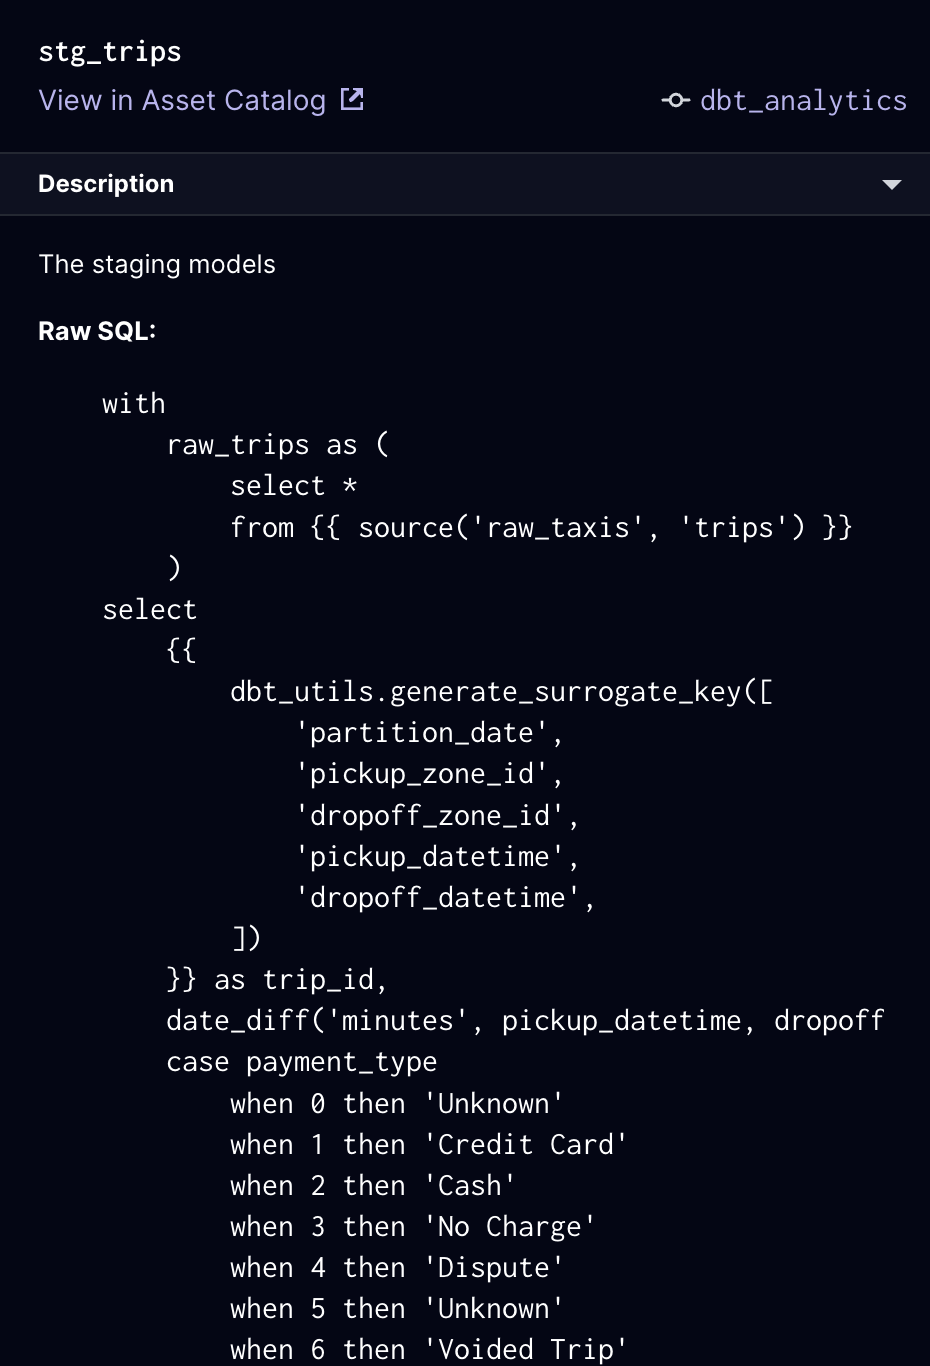
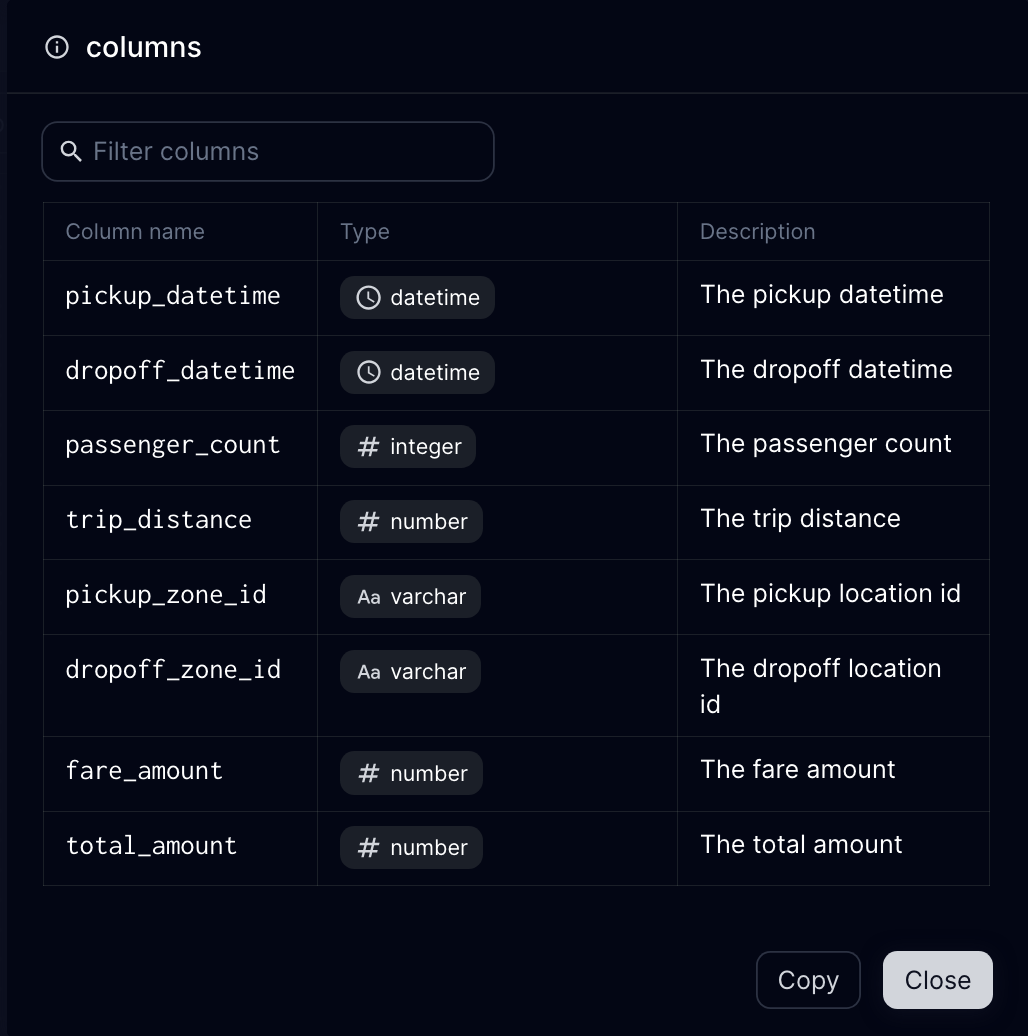
Click the stg_trips node on the asset graph and look at the right sidebar. You’ll get some metadata out-of-the-box, such as the dbt code used for the model, how long the model takes to materialize over time, and the schema of the model.
| dbt model code | Model schema |
|---|---|
 |  |
Running dbt models with Dagster
After clicking around a bit and seeing the dbt models within Dagster, the next step is to materialize them.
- Click the
stg_zonesasset. - Hold Command (or Control on Windows/Linux) and click the
stg_tripsasset. - Click the Materialize selected button toward the top-right section of the asset graph.
- Click the toast notification at the top of the page (or the hash that appears at the bottom right of a dbt asset’s node) to navigate to the run.
- Under the run ID - in this case,
35b467ce- change the toggle from a timed view (stopwatch) to the flat view (blocks).
The run’s page should look similar to this:
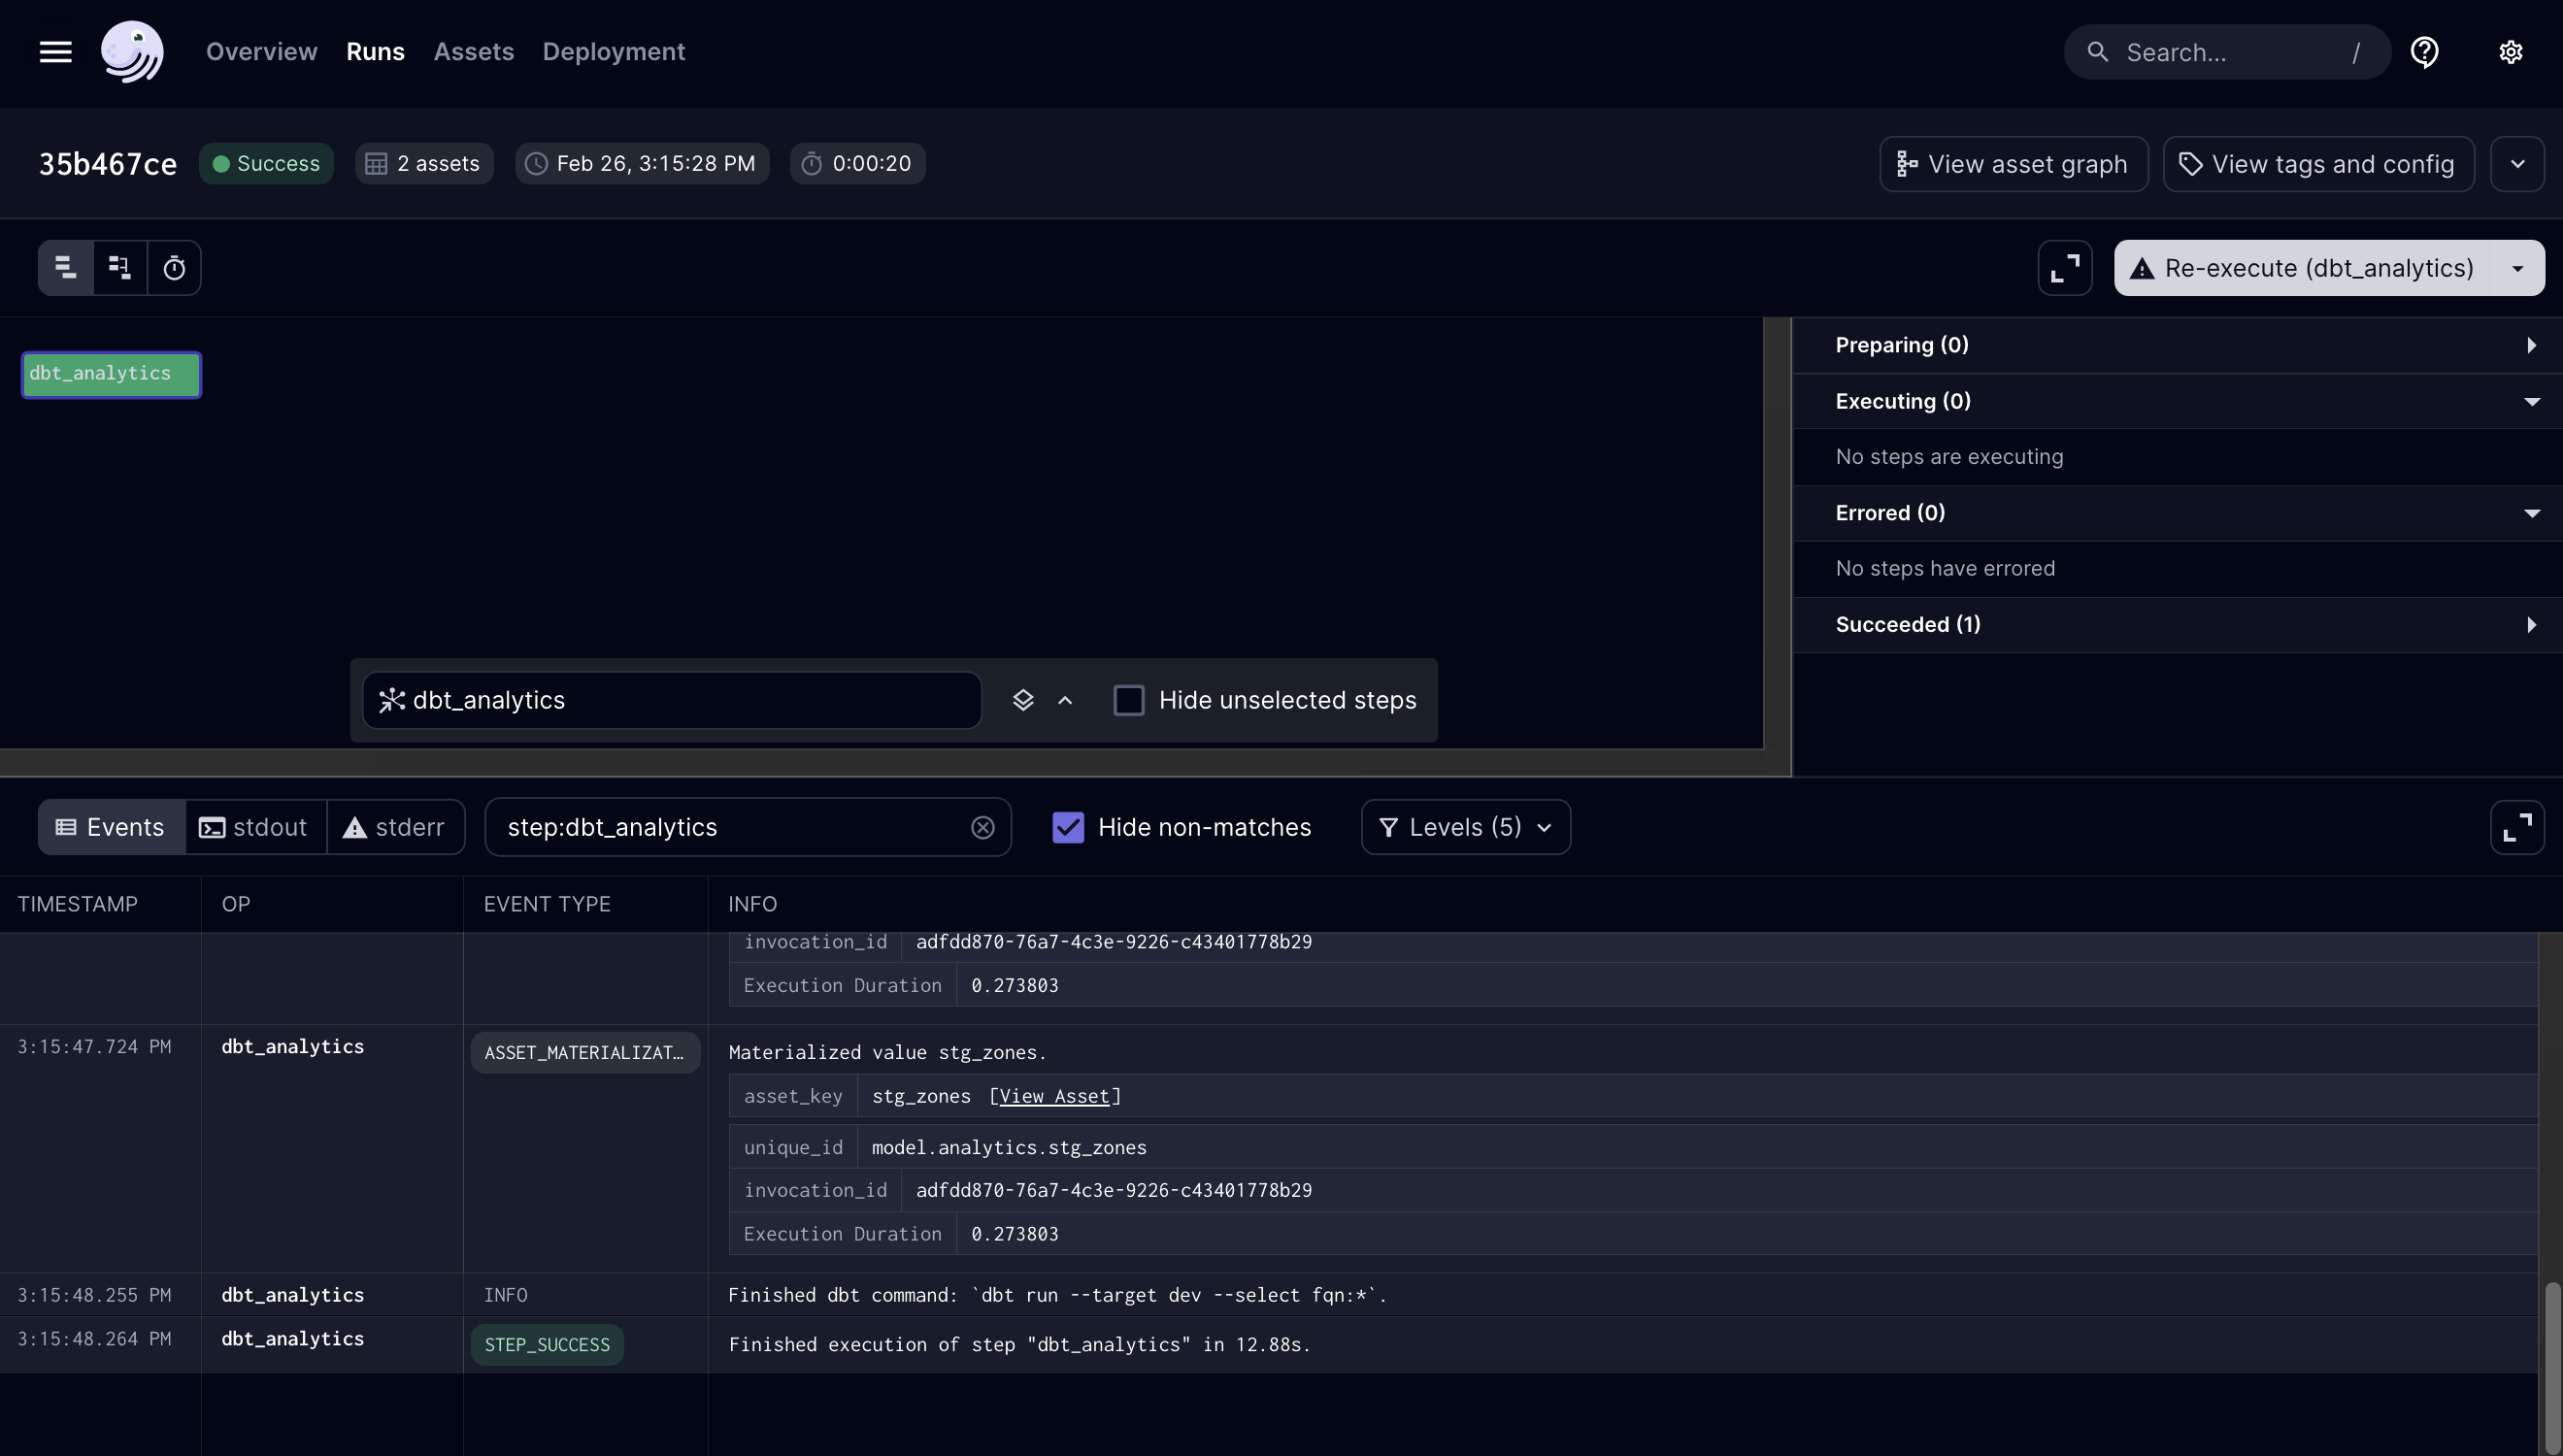
Notice that there is only one “block,” or step, in this chart. That’s because Dagster runs dbt as it’s intended to be run: in a single execution of a dbt CLI command. This step will be named after the @dbt_assets -decorated asset, which we called dbt_analytics in the assets/dbt.py file.
Scrolling through the logs, you’ll see the dbt commands Dagster executes, along with each model materialization. We want to point out two note-worthy logs.
dbt commands
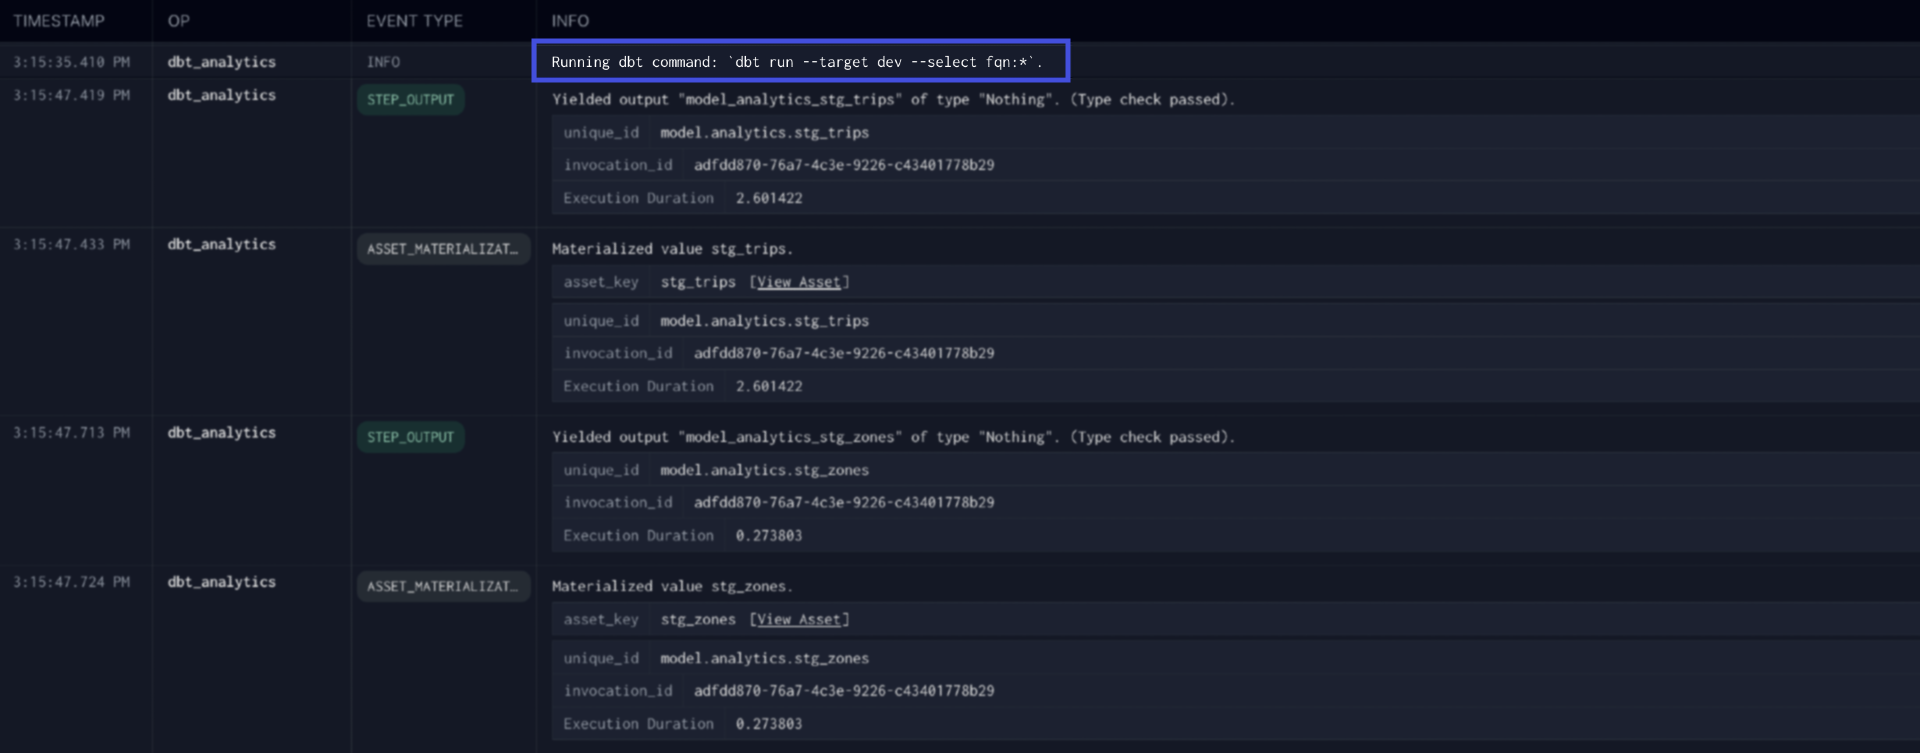
The log statement that indicates what dbt command is being run. Note that this executed the dbt run specified in the dbt_analytics asset.
💡 What’s
--select fqn:*? As mentioned earlier, Dagster tries to run dbt in as few executions as possible.fqnis a dbt selection method that is as explicit as it gets and matches the node names in amanifest.json. The*means it will run all dbt models.
Materialization events
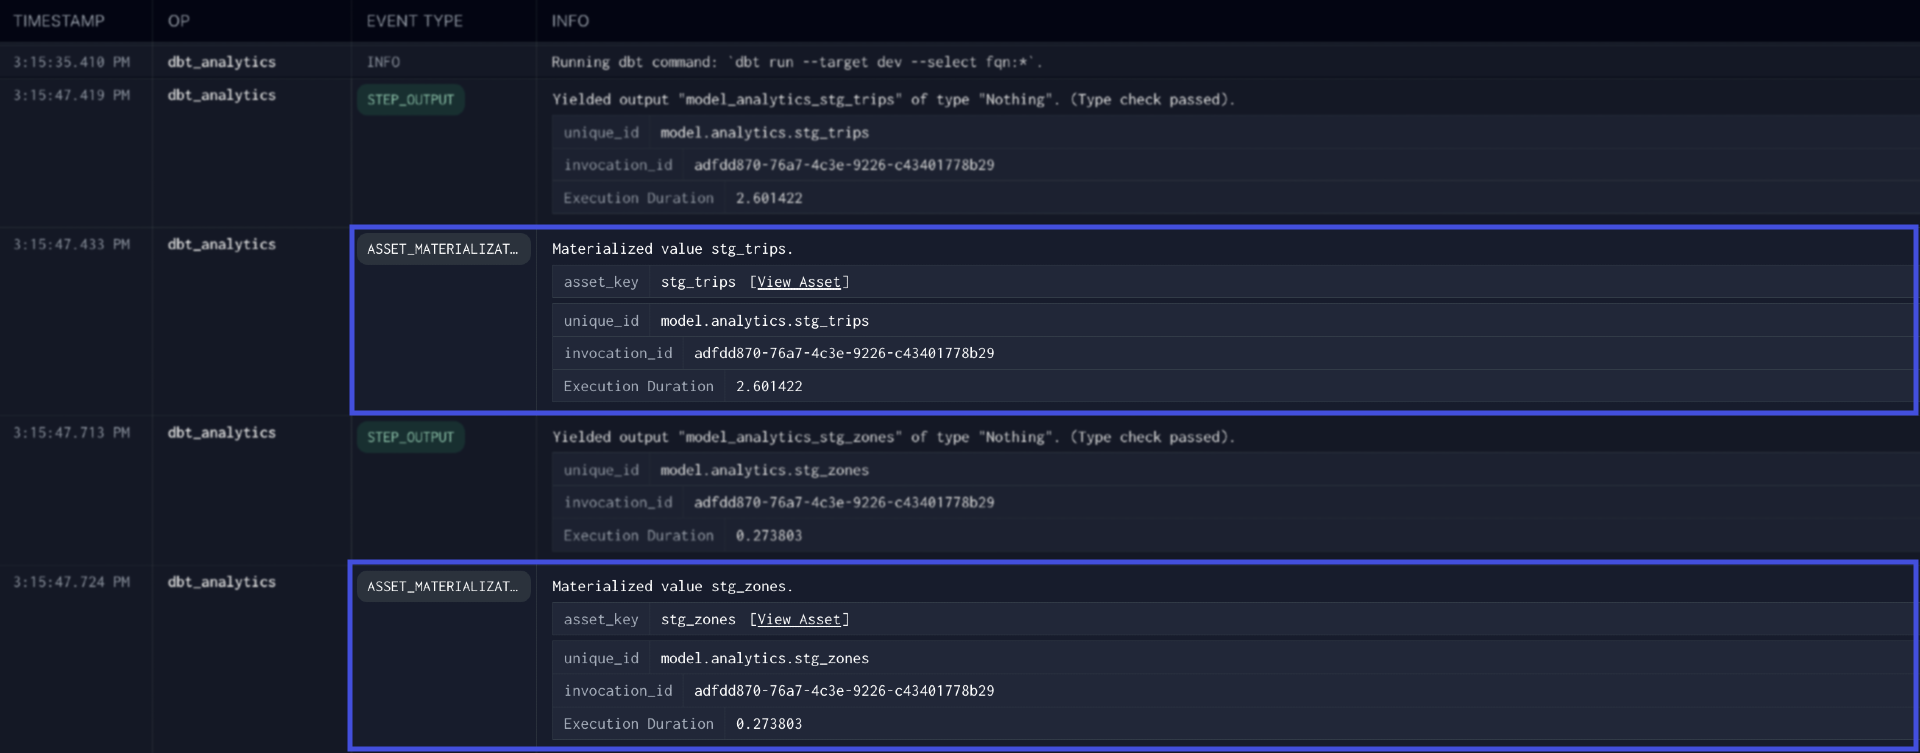
The asset materialization events indicating that stg_zones and stg_trips were successfully materialized during the dbt execution.
Try running just one of the dbt models and see what happens! Dagster will dynamically generate the --select argument based on the assets selected to run.