Creating assets that depend on dbt models
At this point, you’ve loaded your dbt models as Dagster assets and linked the dependencies between the dbt assets and their source Dagster assets. However, a dbt model is typically not the last asset in a pipeline. For example, you might want to:
- Generate a chart,
- Update a dashboard, or
- Send data to Salesforce
In this section, you’ll learn how to do this by defining a new Dagster asset that depends on a dbt model. We’ll make some metrics in a dbt model and then use Python to generate a chart with that data.
If you’re familiar with New York City, you might know that there are three major airports - JFK, LGA, and EWR - in different parts of the metropolitan area. Let's say you’re curious if a traveler's final destination impacts the airport they fly into. For example, how many people staying in Queens flew into LGA?
Creating the dbt model
To answer these questions, let’s define a new dbt model that builds a series of metrics from the staging models you wrote earlier.
In the analytics/models directory:
Create a new directory called
marts.In the
martsdirectory, create a new file calledlocation_metrics.sql.Copy and paste the following into
location_metrics.sql:with trips as ( select * from {{ ref('stg_trips') }} ), zones as ( select * from {{ ref('stg_zones') }} ), trips_by_zone as ( select pickup_zones.zone_name as zone, dropoff_zones.borough as destination_borough, pickup_zones.is_airport as from_airport, count(*) as trips, sum(trips.trip_distance) as total_distance, sum(trips.duration) as total_duration, sum(trips.total_amount) as fare, sum(case when duration > 30 then 1 else 0 end) as trips_over_30_min from trips left join zones as pickup_zones on trips.pickup_zone_id = pickup_zones.zone_id left join zones as dropoff_zones on trips.dropoff_zone_id = dropoff_zones.zone_id group by all ) select * from trips_by_zoneIn the Dagster UI, reload the code location.
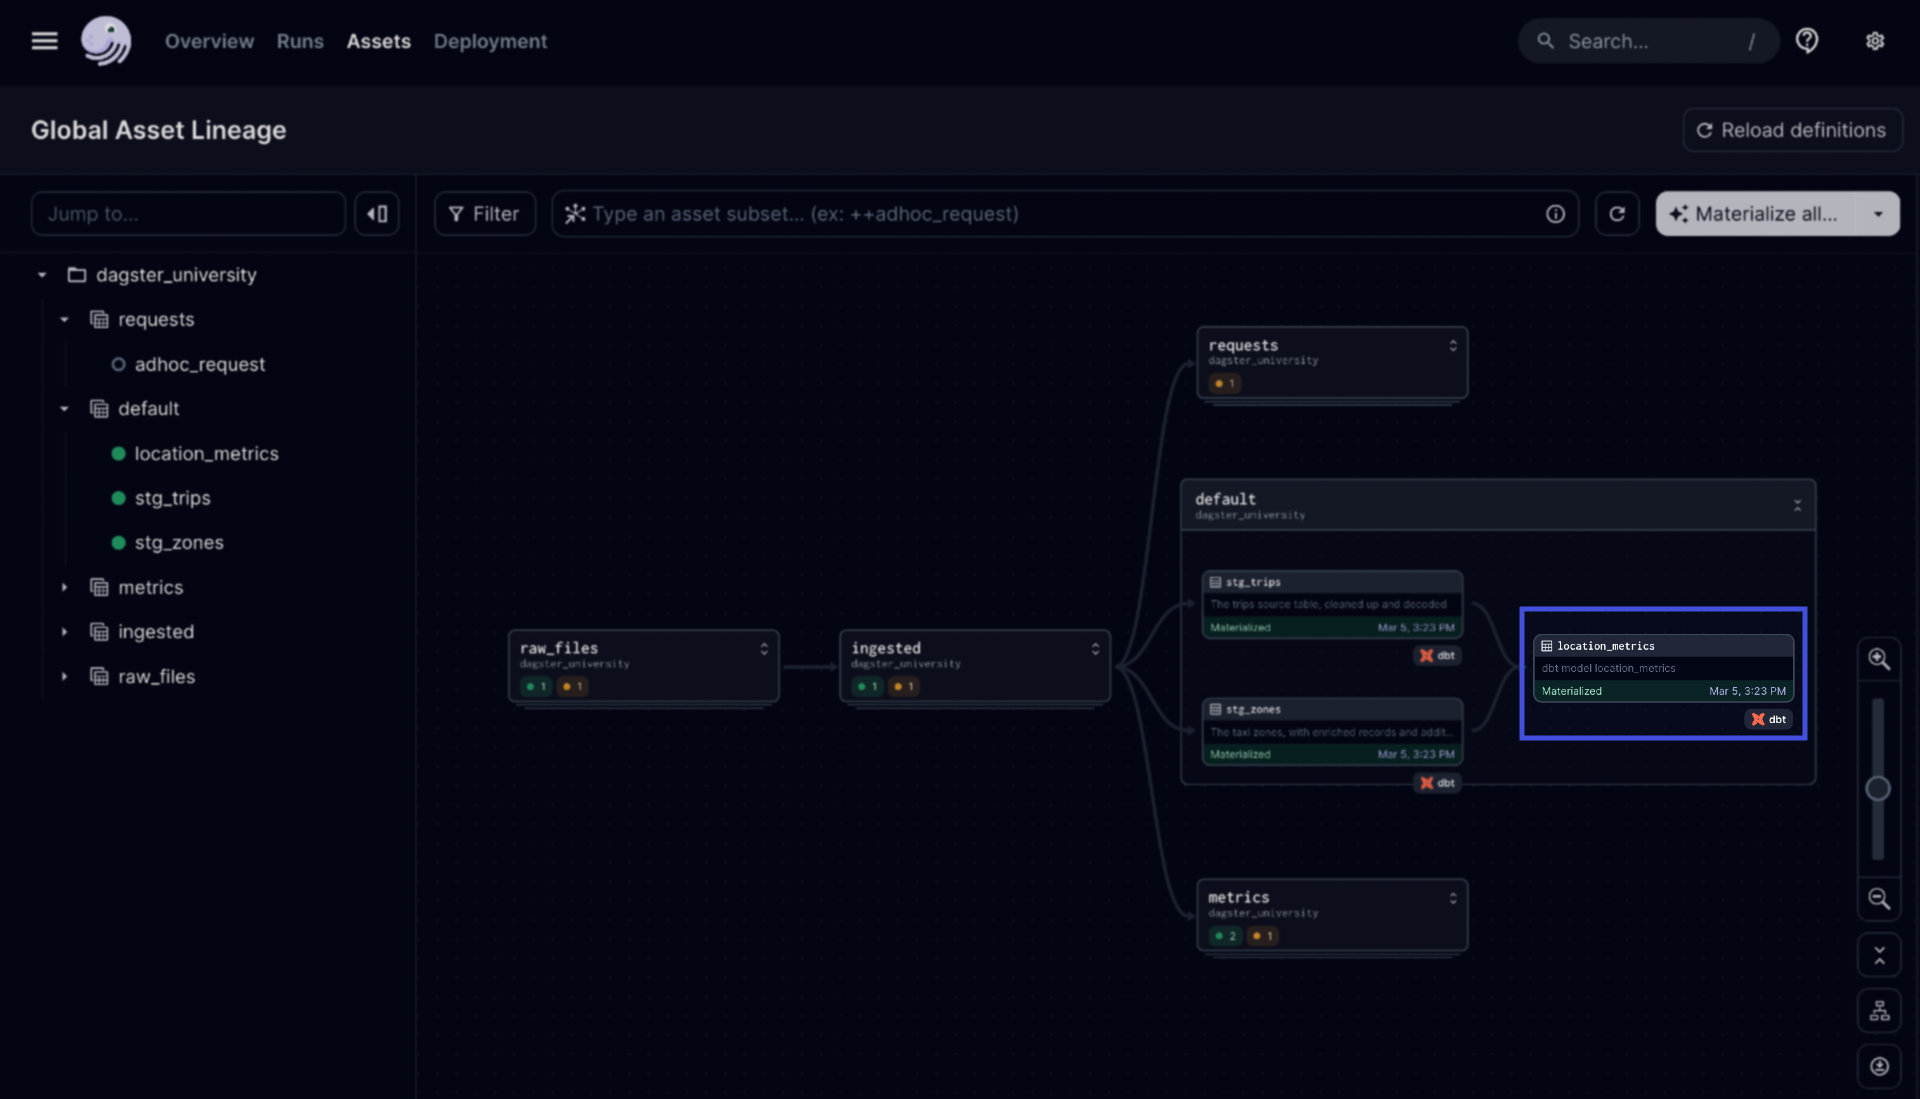
Observe and materialize the new
location_metricsdbt asset:
Creating the Dagster asset
Next, we’ll create an asset that uses some of the columns in the location_metrics model to chart the number of taxi trips that happen per major NYC airport and the borough they come from.
Adding a new constant
Let's start by adding a new string constant to reference when building the new asset. This will make it easier for us to reference the correct location of the chart in the asset.
In the assets/constants.py file, add the following to the end of the file:
AIRPORT_TRIPS_FILE_PATH = get_path_for_env(os.path.join("data", "outputs", "airport_trips.png"))
This creates a path to where we want to save the chart. The get_path_for_env utilty function is not specific to Dagster, but rather is a utility function we've defined in this file to help with Lesson 7 (Deploying your Dagster and dbt project).
Creating the airport_trips asset
Now we’re ready to create the asset!
Open the
assets/metrics.pyfile.At the end of the file, define a new asset called
airport_tripswith the existingDuckDBResourcenameddatabaseand it will return aMaterializeResult, indicating that we'll be returning some metadata:def airport_trips(database: DuckDBResource) -> MaterializeResult:Add the asset decorator to the
airport_tripsfunction and specify thelocation_metricsmodel as a dependency:@asset( deps=["location_metrics"], ) def airport_trips(database: DuckDBResource) -> MaterializeResult:Note: Because Dagster doesn’t discriminate and treats all dbt models as assets, you’ll add this dependency just like you would with any other asset.
Fill in the body of the function with the following code to follow a similar pattern to your project’s existing pipelines: query for the data, use a library to generate a chart, save the chart as a file, and embed the chart.
At this point, the
airport_tripsasset should look like this:@asset( deps=["location_metrics"], ) def airport_trips(database: DuckDBResource) -> MaterializeResult: """ A chart of where trips from the airport go """ query = """ select zone, destination_borough, trips from location_metrics where from_airport """ with database.get_connection() as conn: airport_trips = conn.execute(query).fetch_df() fig = px.bar( airport_trips, x="zone", y="trips", color="destination_borough", barmode="relative", labels={ "zone": "Zone", "trips": "Number of Trips", "destination_borough": "Destination Borough" }, ) pio.write_image(fig, constants.AIRPORT_TRIPS_FILE_PATH) with open(constants.AIRPORT_TRIPS_FILE_PATH, 'rb') as file: image_data = file.read() # Convert the image data to base64 base64_data = base64.b64encode(image_data).decode('utf-8') md_content = f"" return MaterializeResult( metadata={ "preview": MetadataValue.md(md_content) } )Reload your code location to see the new
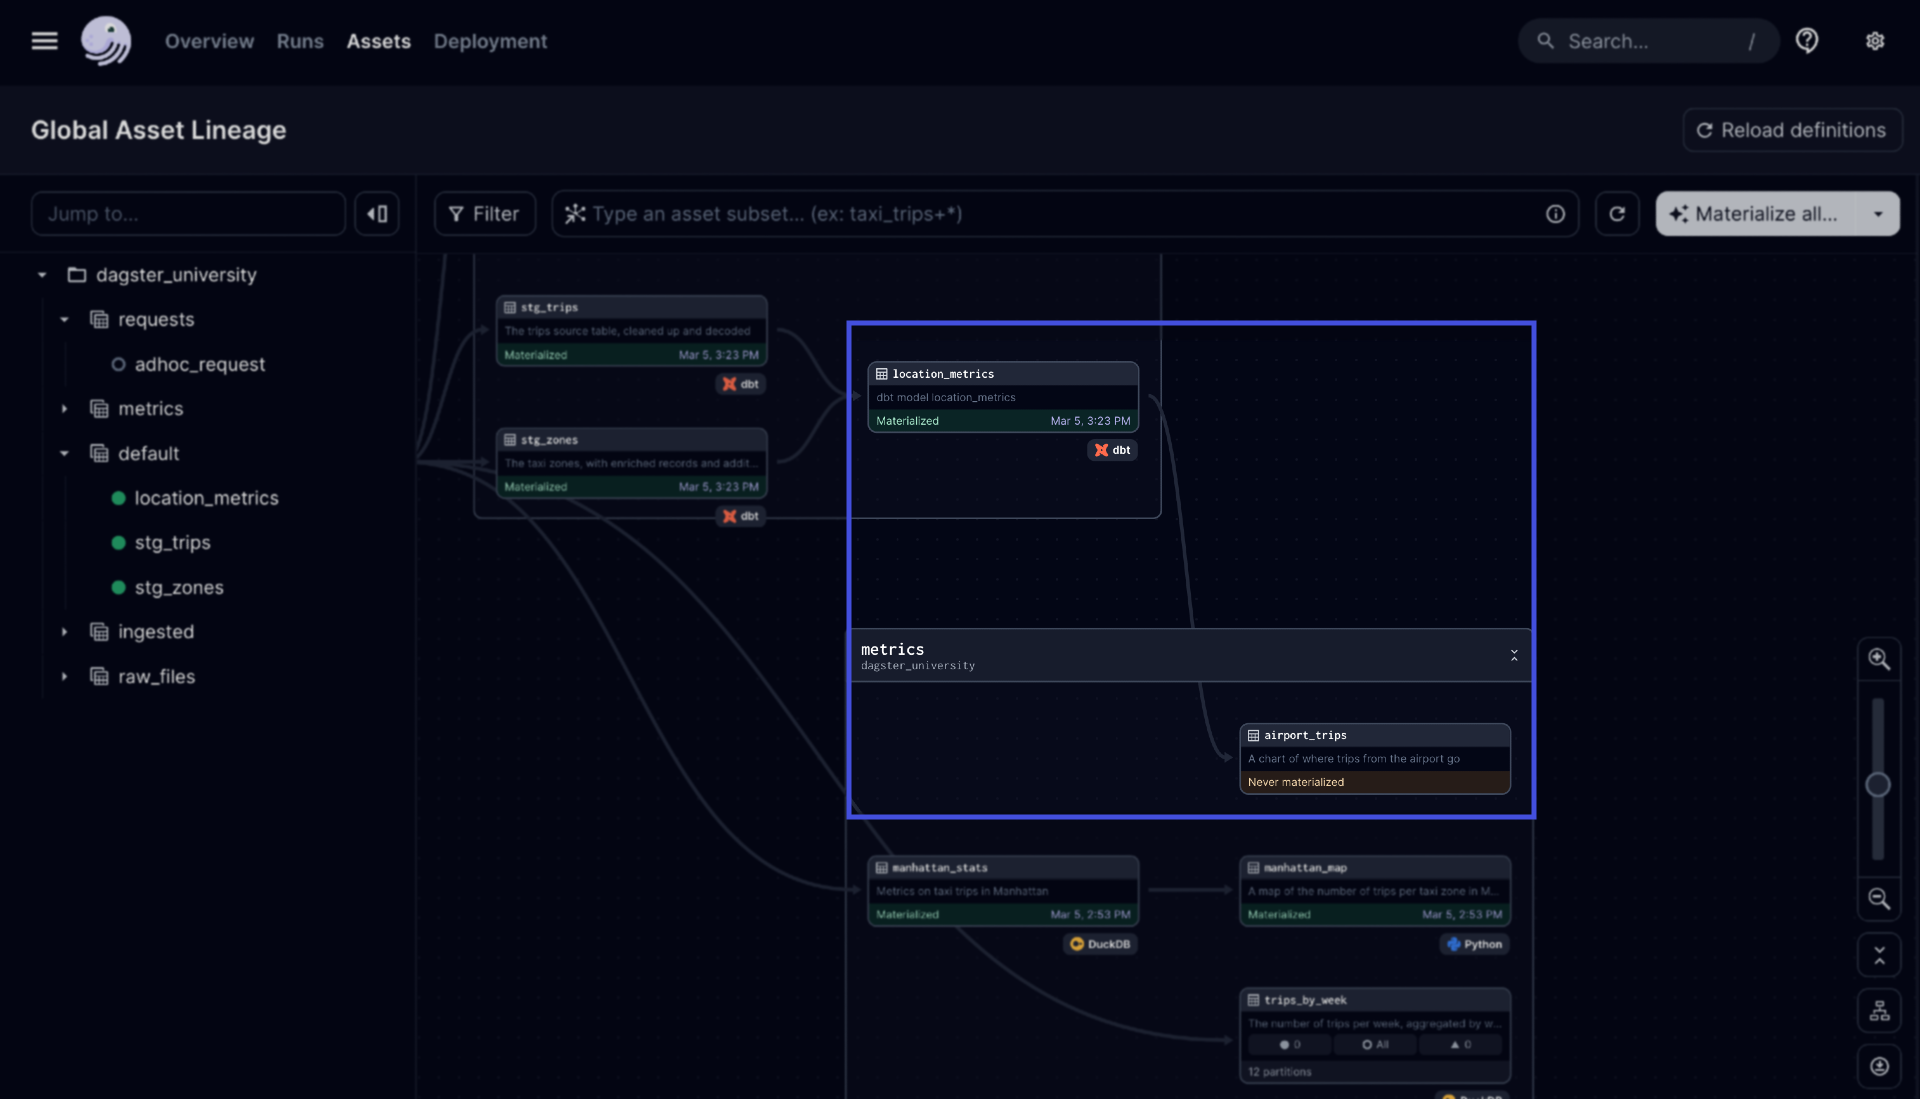
airport_tripsasset within themetricsgroup. Notice how the asset graph links the dependency between thelocation_metricsdbt asset and the newairport_tripschart asset: