Troubleshooting failed runs
Now that you’re familiar with how assets are materialized and where to find details about their execution, let’s focus on how to troubleshoot issues. To demonstrate how to troubleshoot, you’ll intentionally cause the taxi_trips_file asset to fail.
In the assets/trips.py file, comment out the from . import constants line so it looks like this:
import requests
# from . import constants # <---- Import commented out here
from dagster import asset

@asset
def taxi_trips_file() -> None:
    """
      The raw parquet files for the taxi trips dataset. Sourced from the NYC Open Data portal.
    """
    month_to_fetch = '2023-03'
    raw_trips = requests.get(
        f"https://d37ci6vzurychx.cloudfront.net/trip-data/yellow_tripdata_{month_to_fetch}.parquet"
    )

    with open(constants.TAXI_TRIPS_TEMPLATE_FILE_PATH.format(month_to_fetch), "wb") as output_file:
        output_file.write(raw_trips.content)
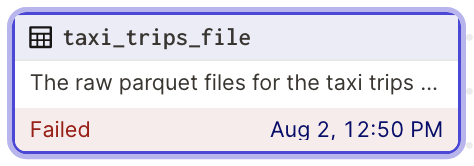
In the Dagster UI, navigate to the Global asset lineage page and click Materialize again to try materializing the taxi_trips_file asset. As expected, the run will fail, resulting in the asset looking like this in the graph:
Click the date in the asset to open the Run details page again. As you can see, it looks quite a bit different from the happy green success we saw before:
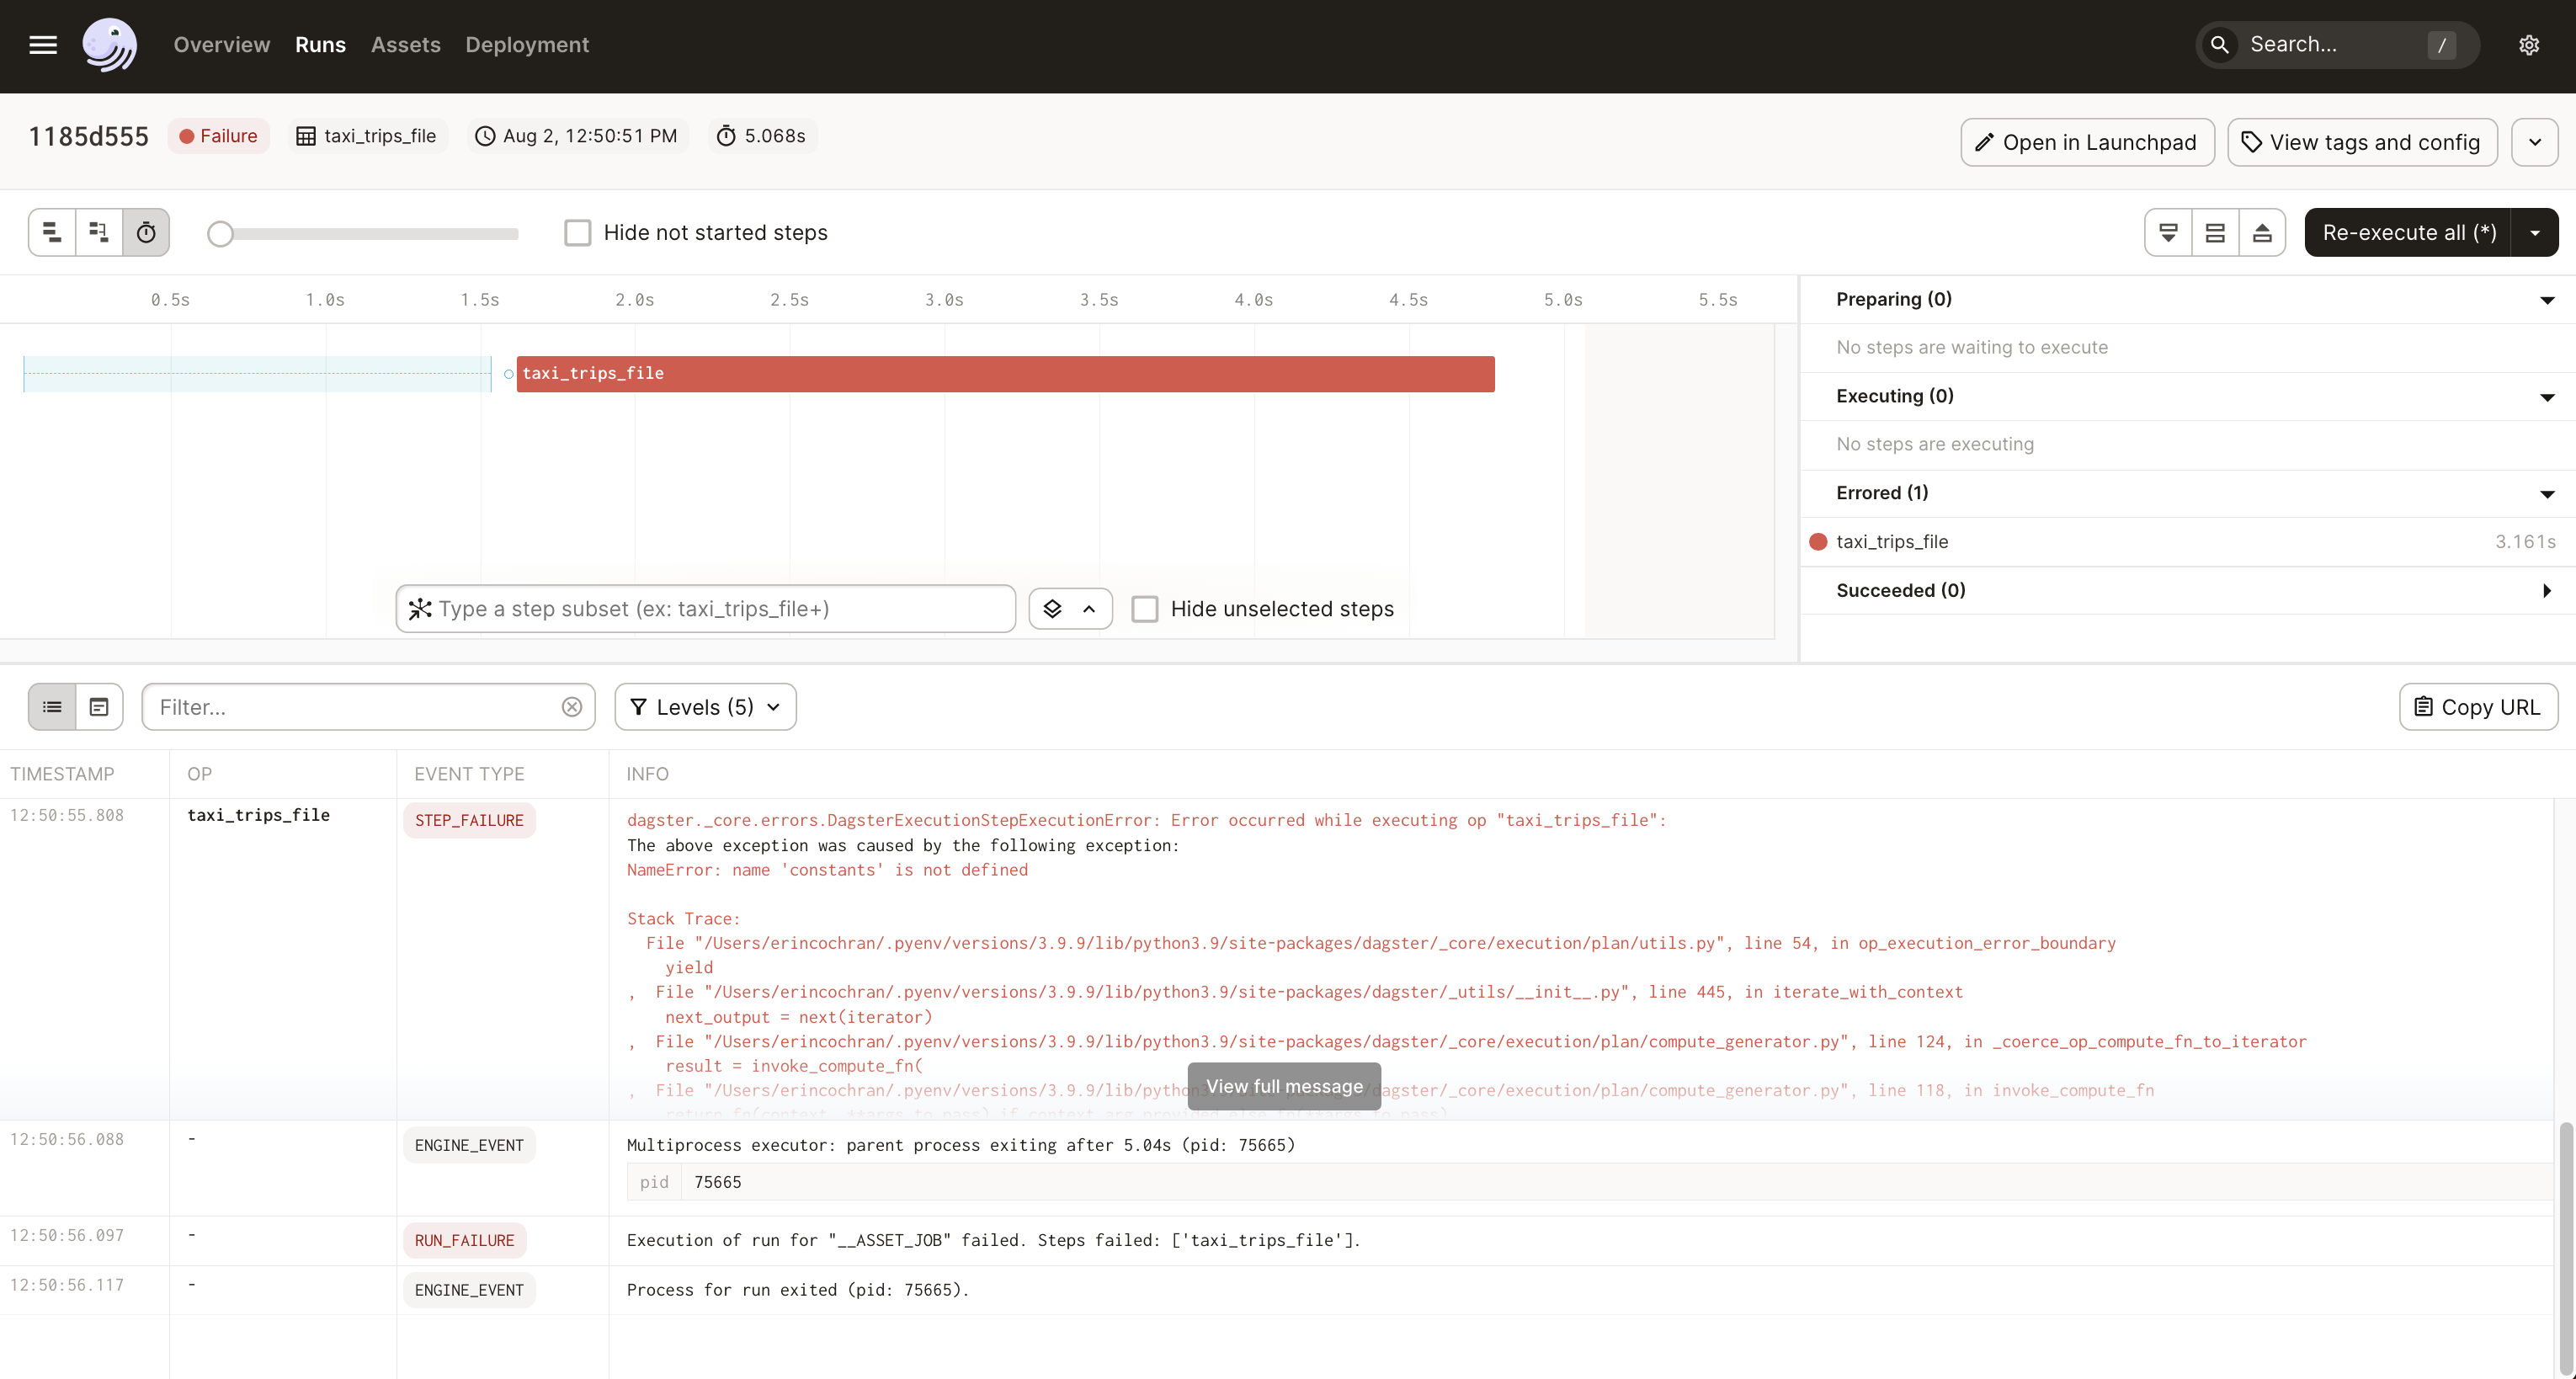
When a run results in an error, the Run details page will indicate that something went wrong by:
- Displaying a Failure status in the Run stats
- Highlighting the problem step (or steps) in the Run timeline in red
- Listing the problem step(s) in the Errored section next to the Run timeline
- Displaying detailed error information about the problem step(s) in the Run logs
To hone in on what went wrong, let’s take a closer look at the logs. We’ll use the structured view of the logs for this example.
Using logs to troubleshoot
| Step one | |
|---|---|
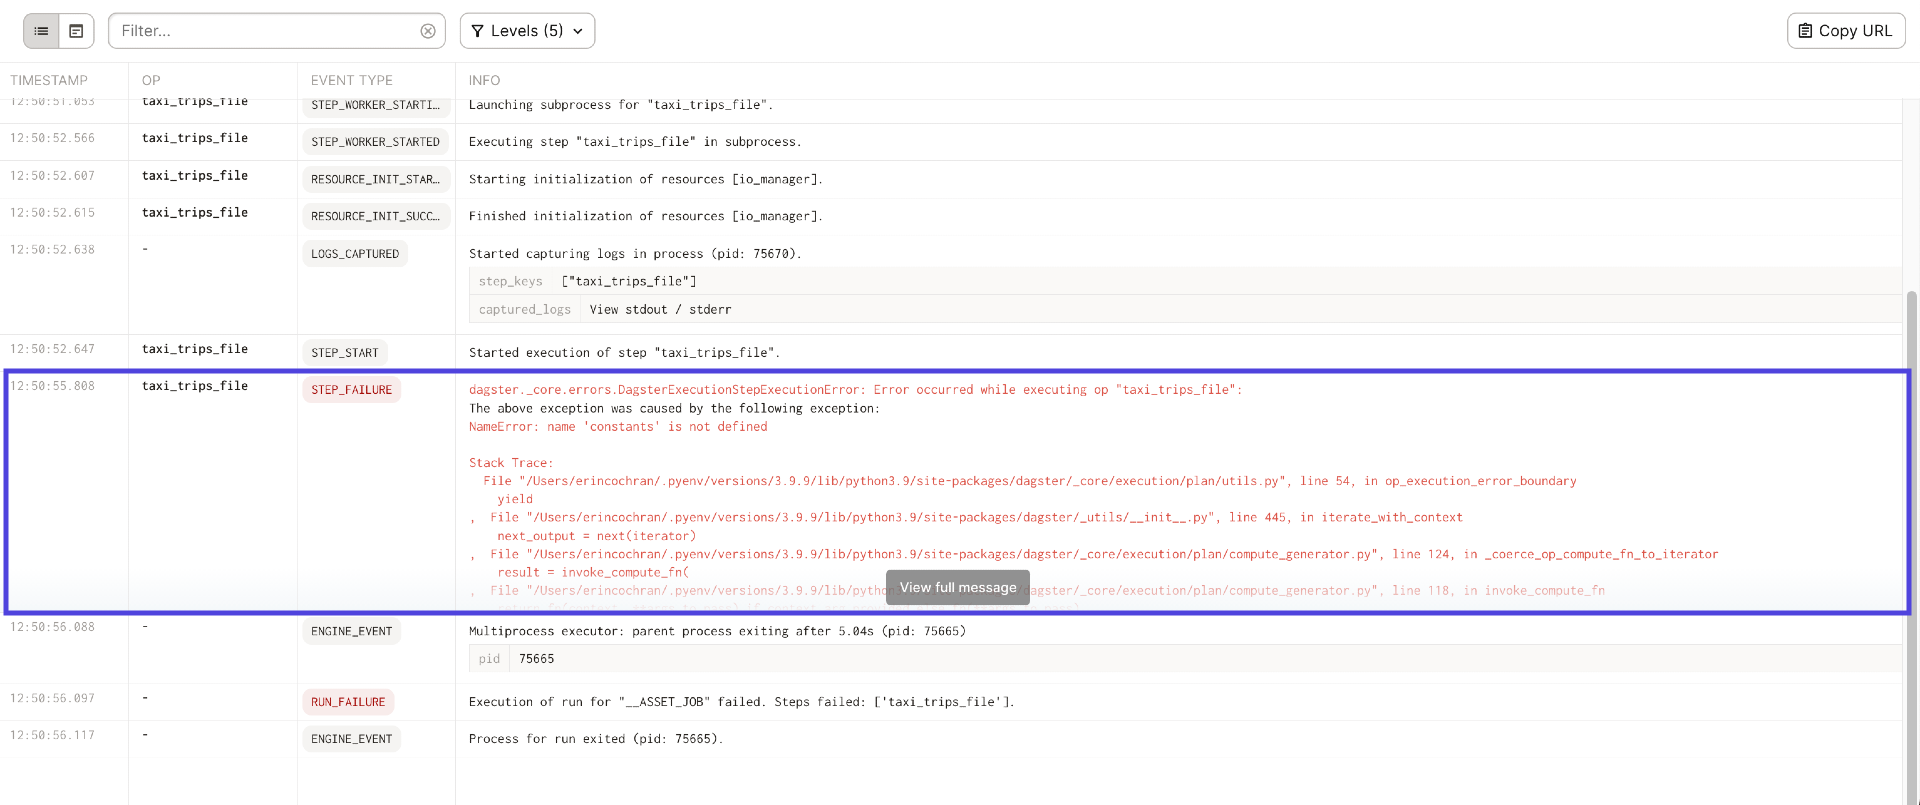
In the logs, locate the step that failed by looking for a STEP_FAILURE event. We’ve highlighted the problem step in the image to the right. |
|
| Step two | |
|---|---|
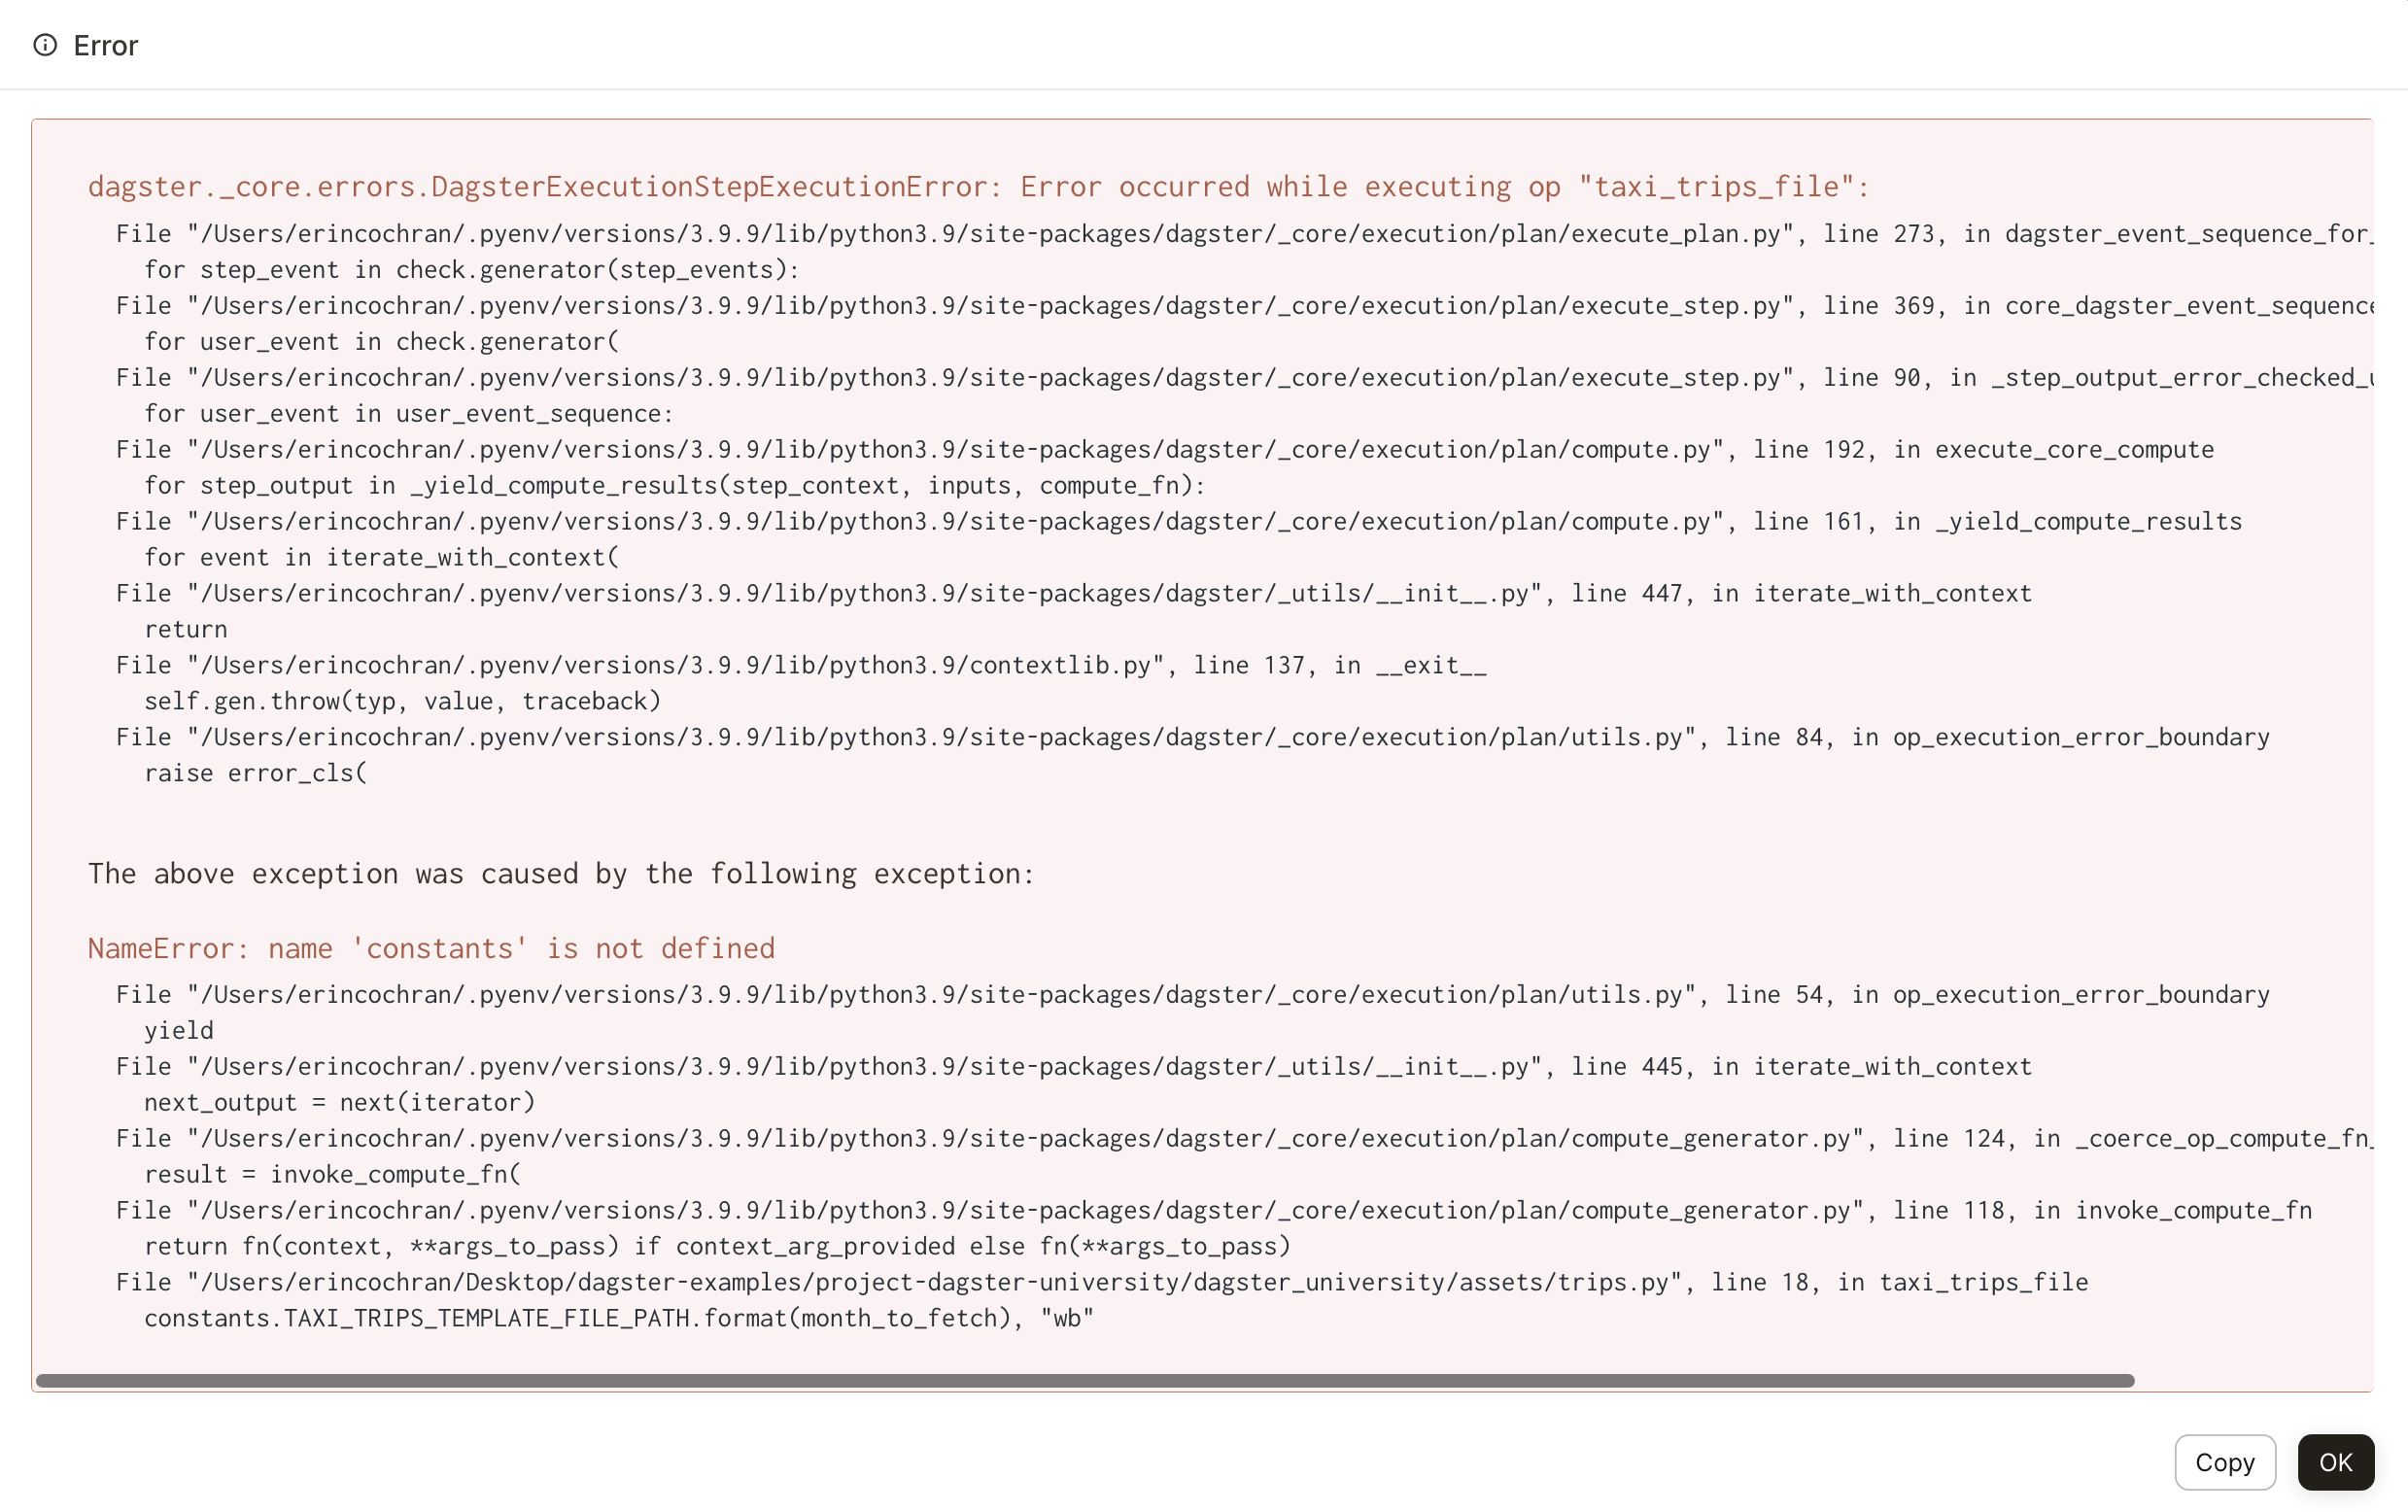
In the INFO column for the failed step, click the View full message button to display the full stacktrace. A popover window like the one to the right will display. At this point, you can use the stacktrace to identify and fix the cause of the error. In this case, it’s because we didn’t import To fix this, uncomment the In the Dagster UI, click OK to close the popover window from the run logs. |
|
| Step three | |
|---|---|
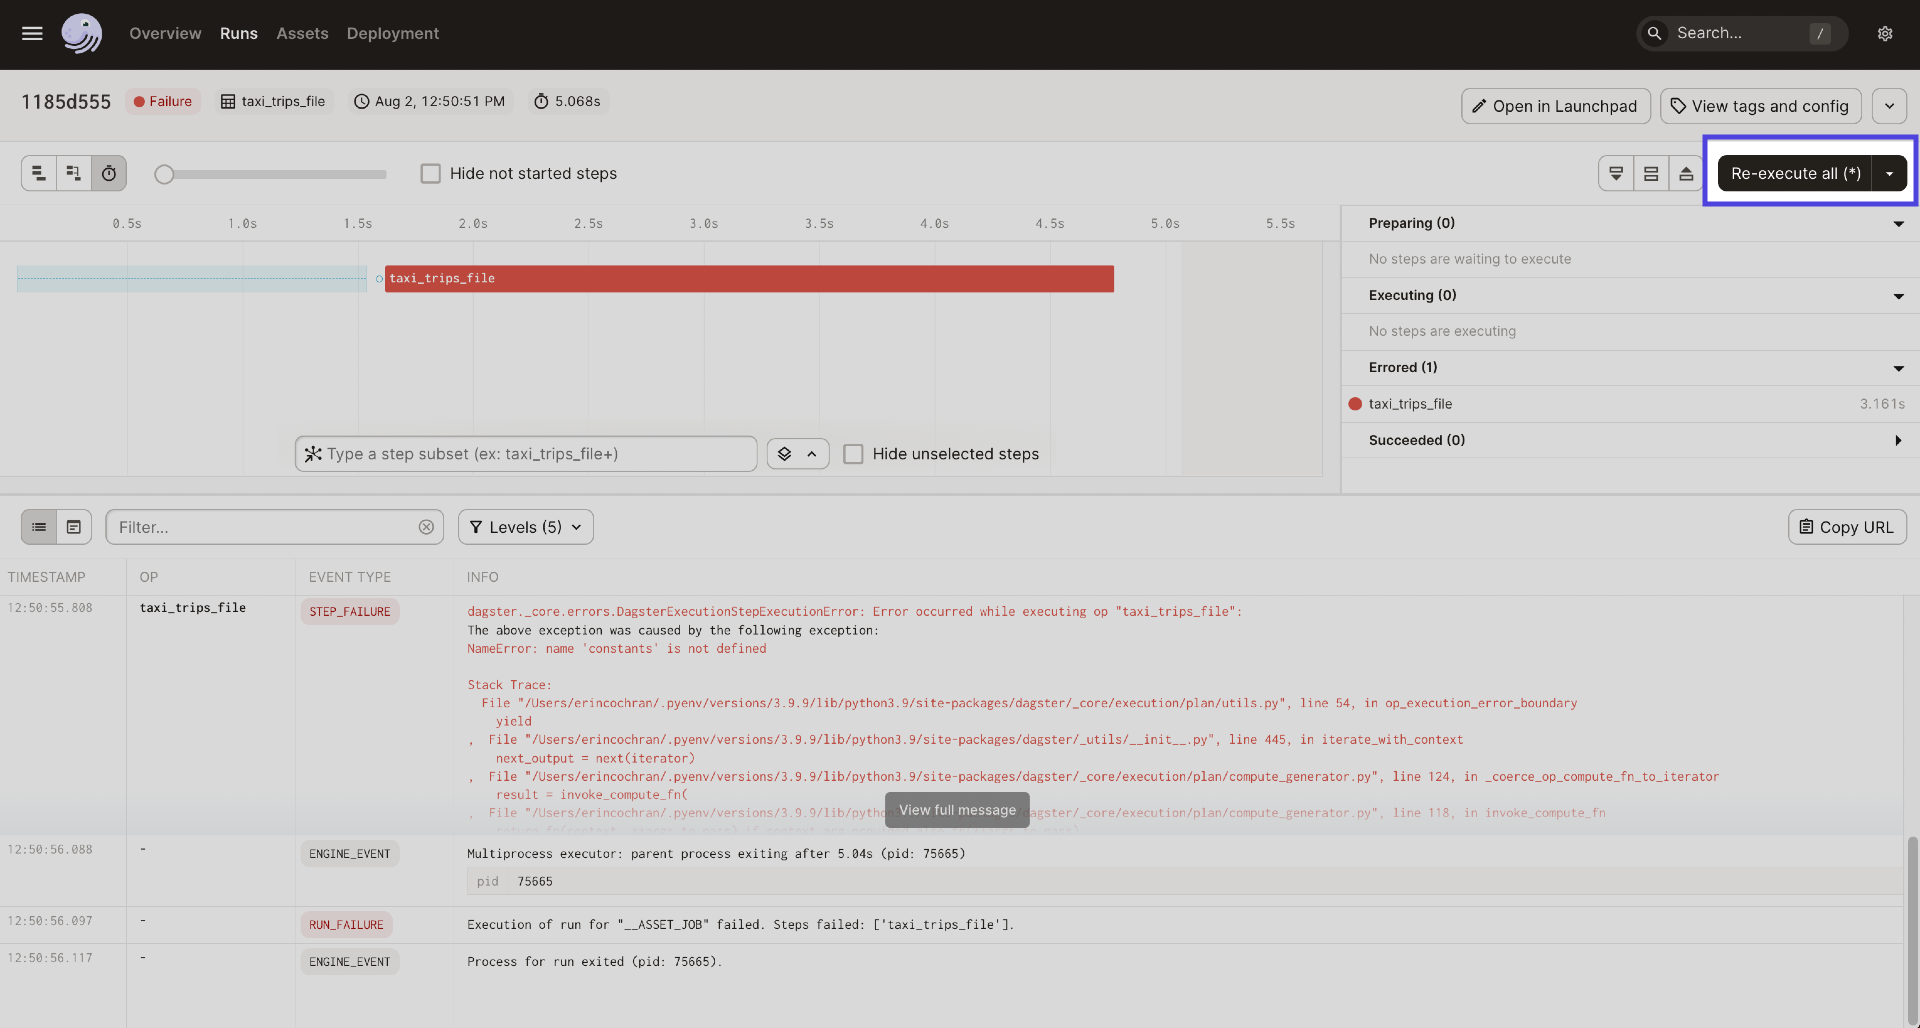
After adding the import back in and saving the In the Run details page, locate and click the Re-execute all (*) button near the top-right corner of the page. This will re-execute all the steps in the run. |
|
| Step four | |
|---|---|
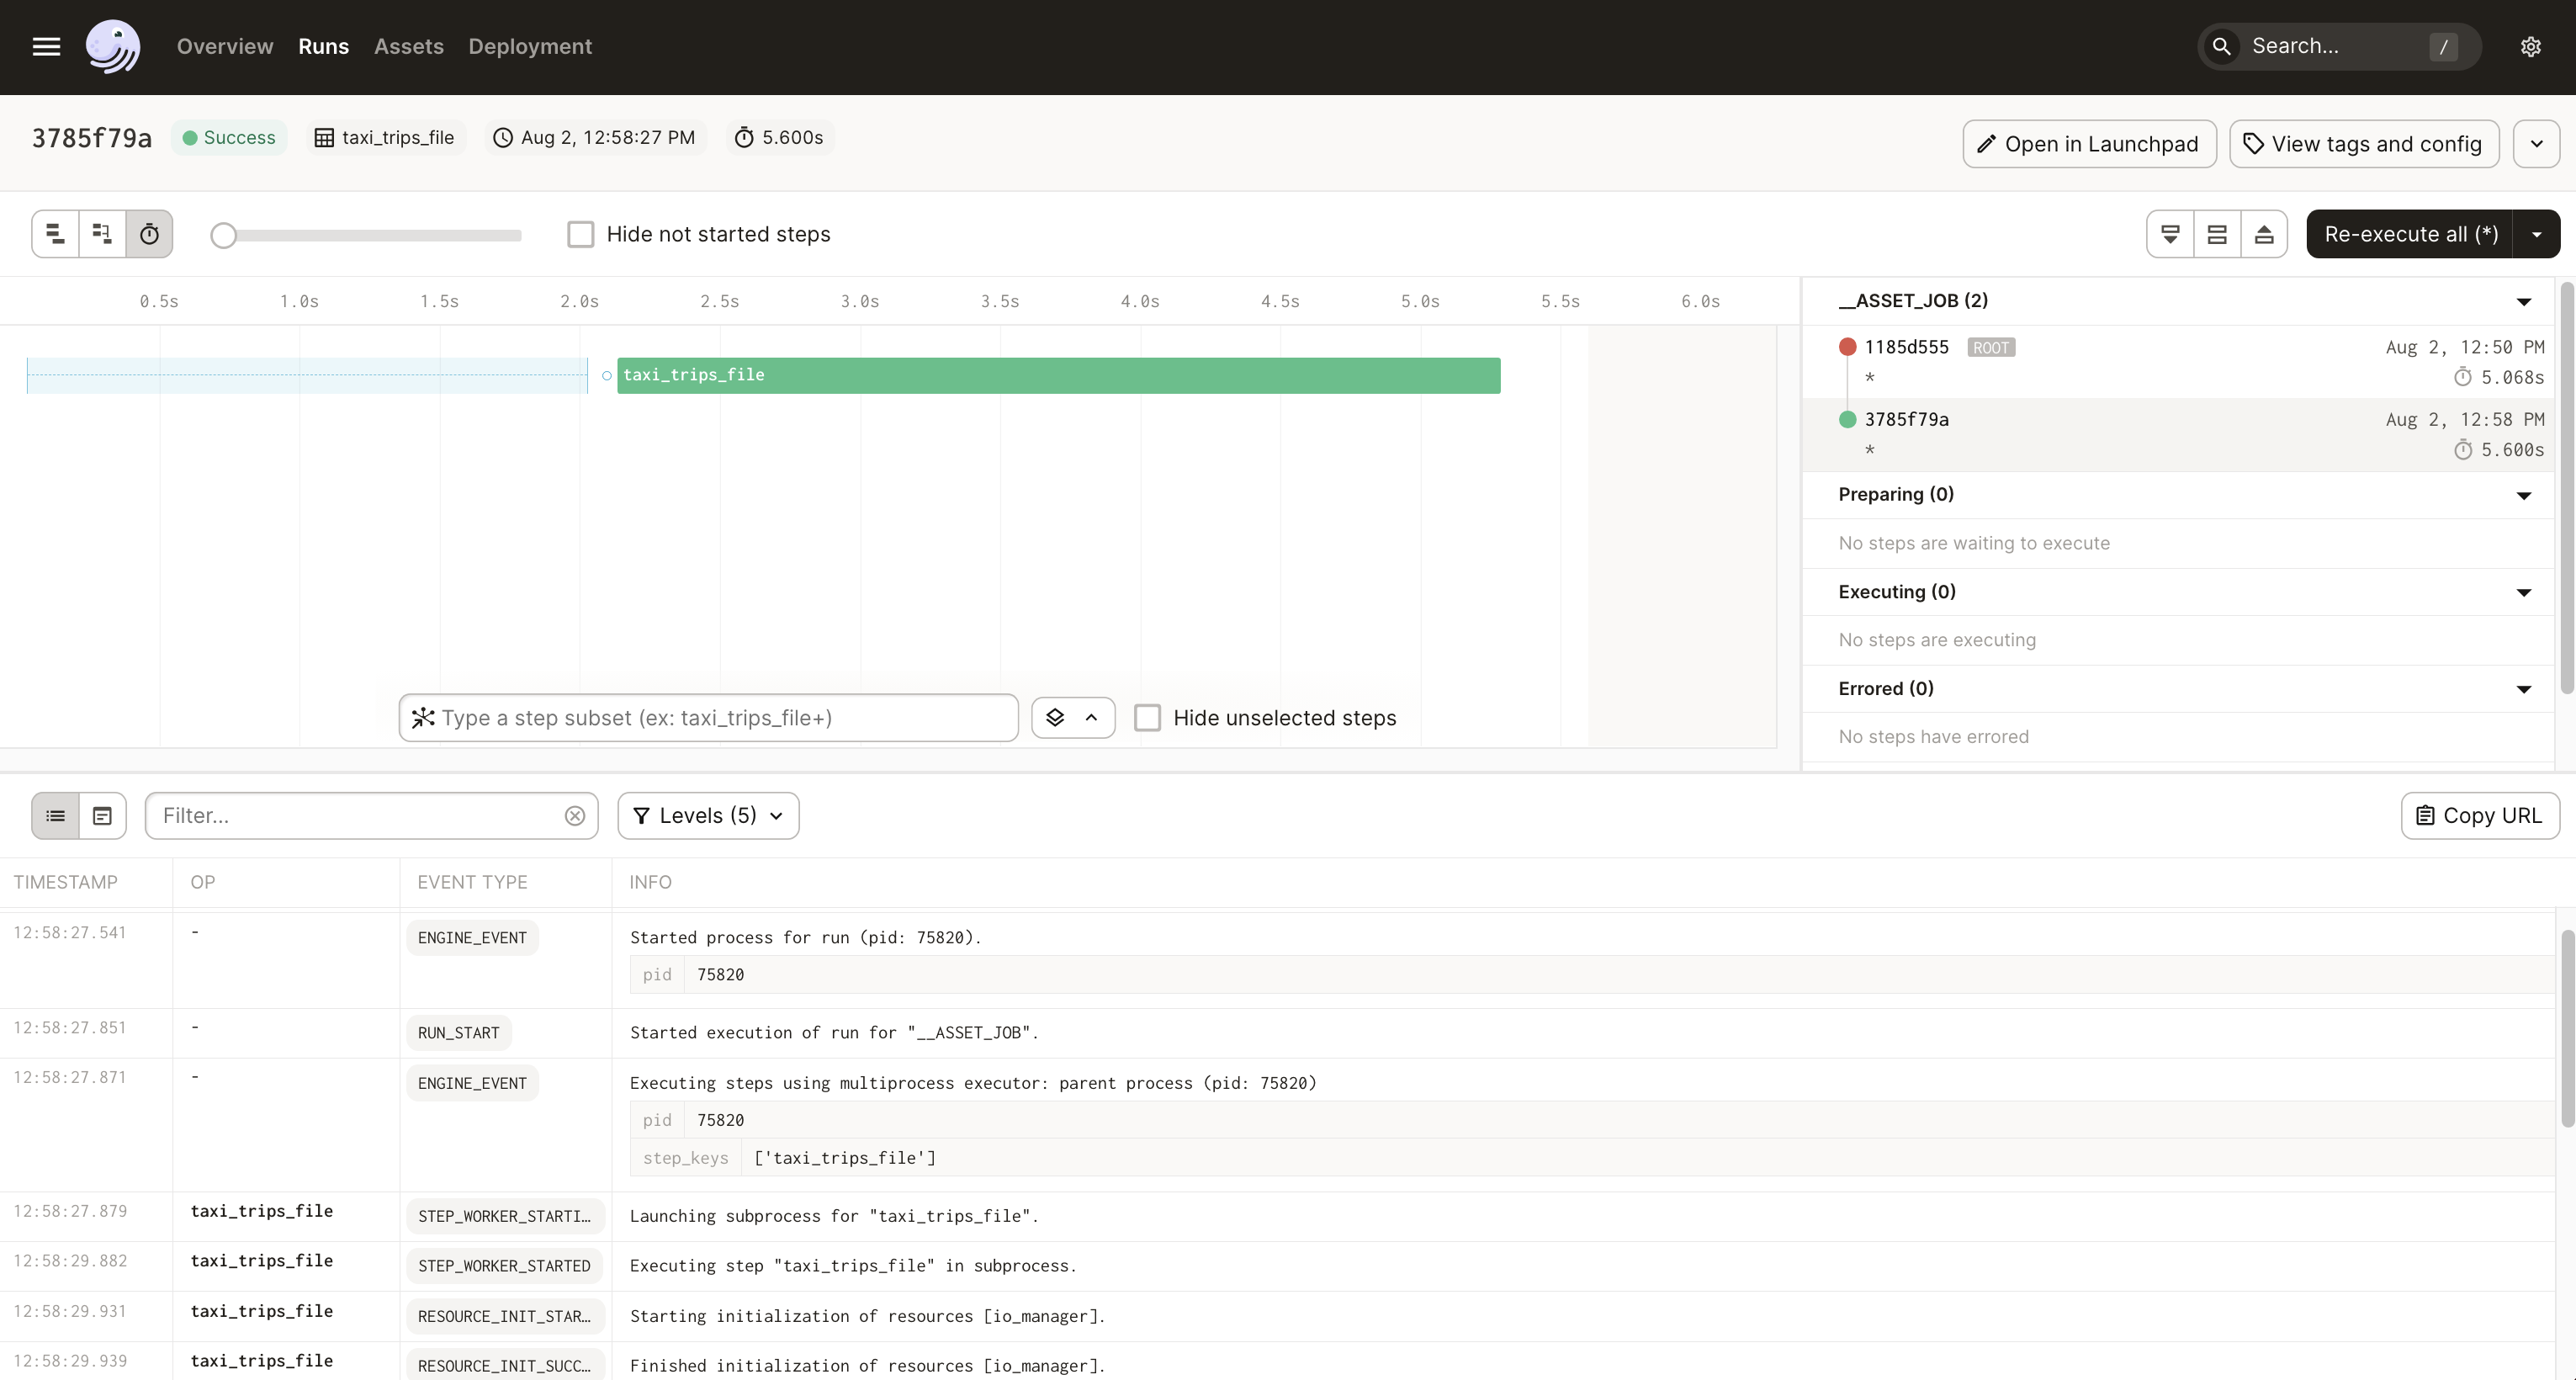
At this point, the run should successfully materialize the asset! The Run details page will look similar to the image on the right, indicating that while the root (original) run failed, the re-execution was successful. |
|
