Enabling the sensor

As sensors are turned off by default, you'll need to enable the sensor to be able to use it. In this section, we'll walk you through turning the sensor on in the Dagster UI.

Step one

In data/requests, you’ll find a README that contains instructions for triggering the sensor. Use the example .json in the README to create a new file named january-staten-island.json that contains the code on the right.

{
  "start_date": "2023-01-10",
  "end_date": "2023-01-25",
  "borough": "Staten Island"
}
Step two

Dagster provides the ability to test sensors directly from the UI, which can be helpful with simulating sensors that are triggered either too frequently or not frequently enough.

  1. If you navigated away from the Sensor details page for the adhoc_request_sensor, navigate back to it before continuing.

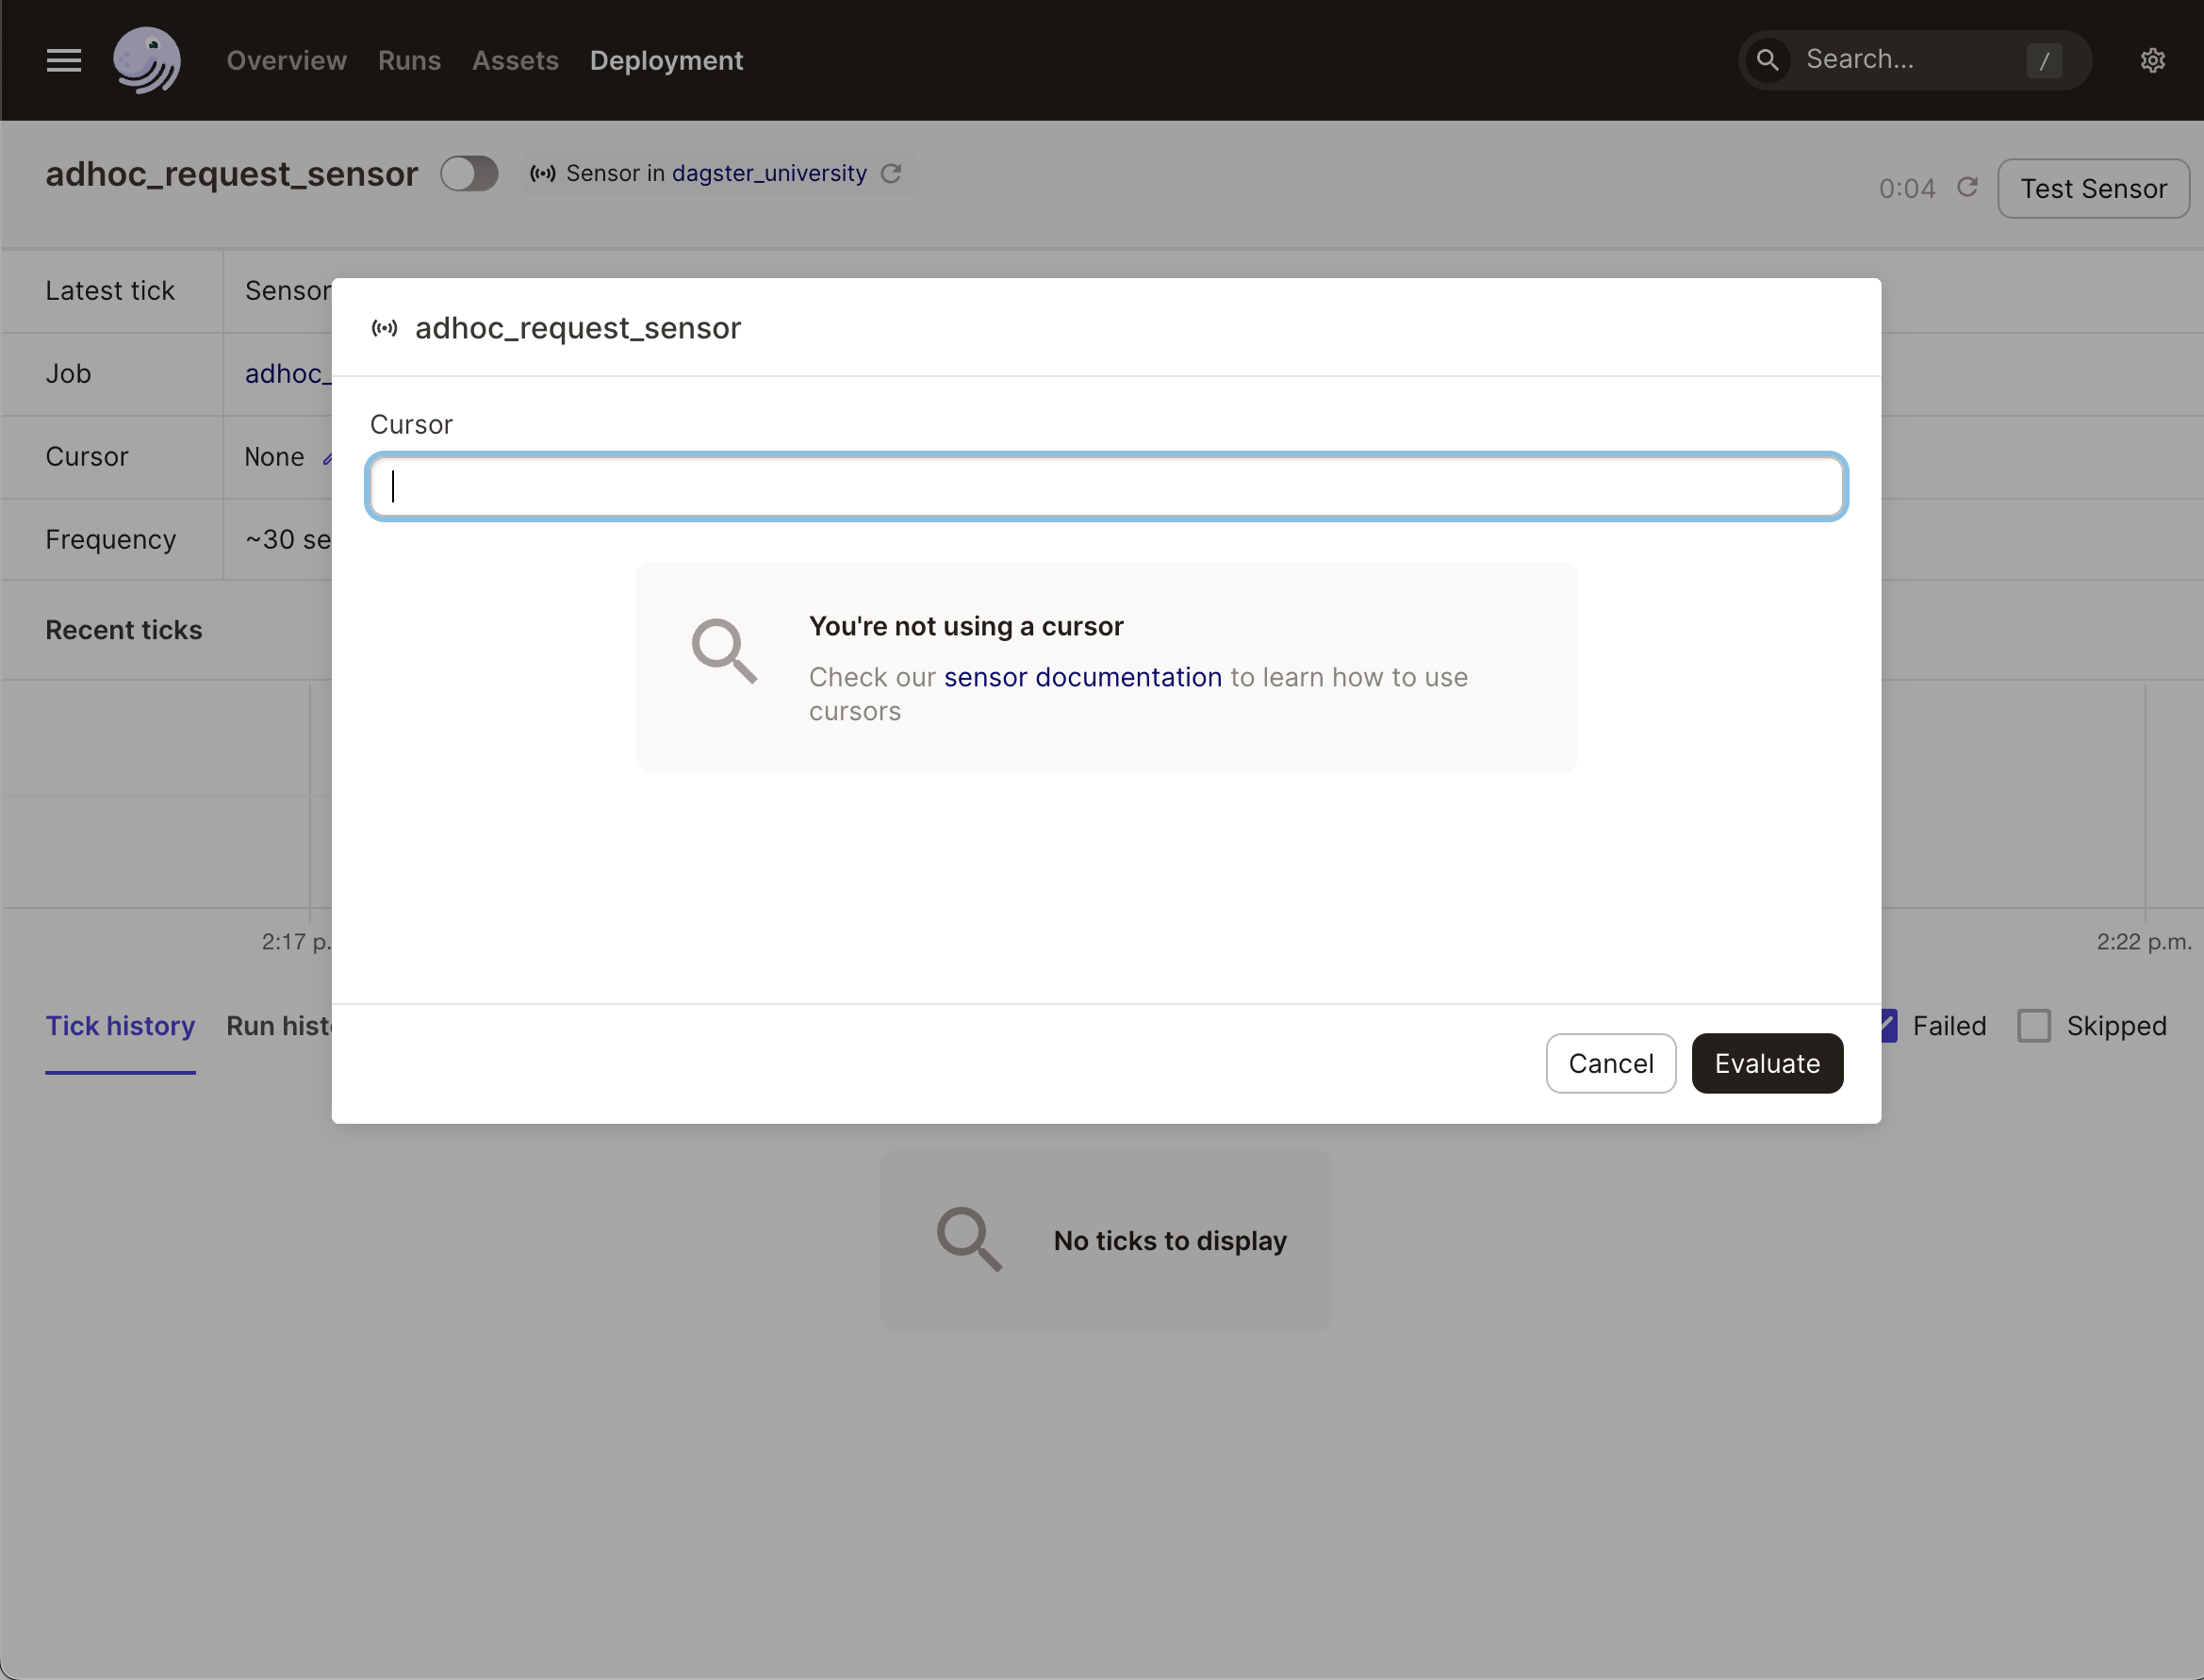
  2. On this page, click the Test Sensor button near the top-right of the page. This allows you to produce a single tick without turning the sensor on.

  3. Click Evaluate to begin the test.

The Test Sensor dialog in the Dagster UI

Step three

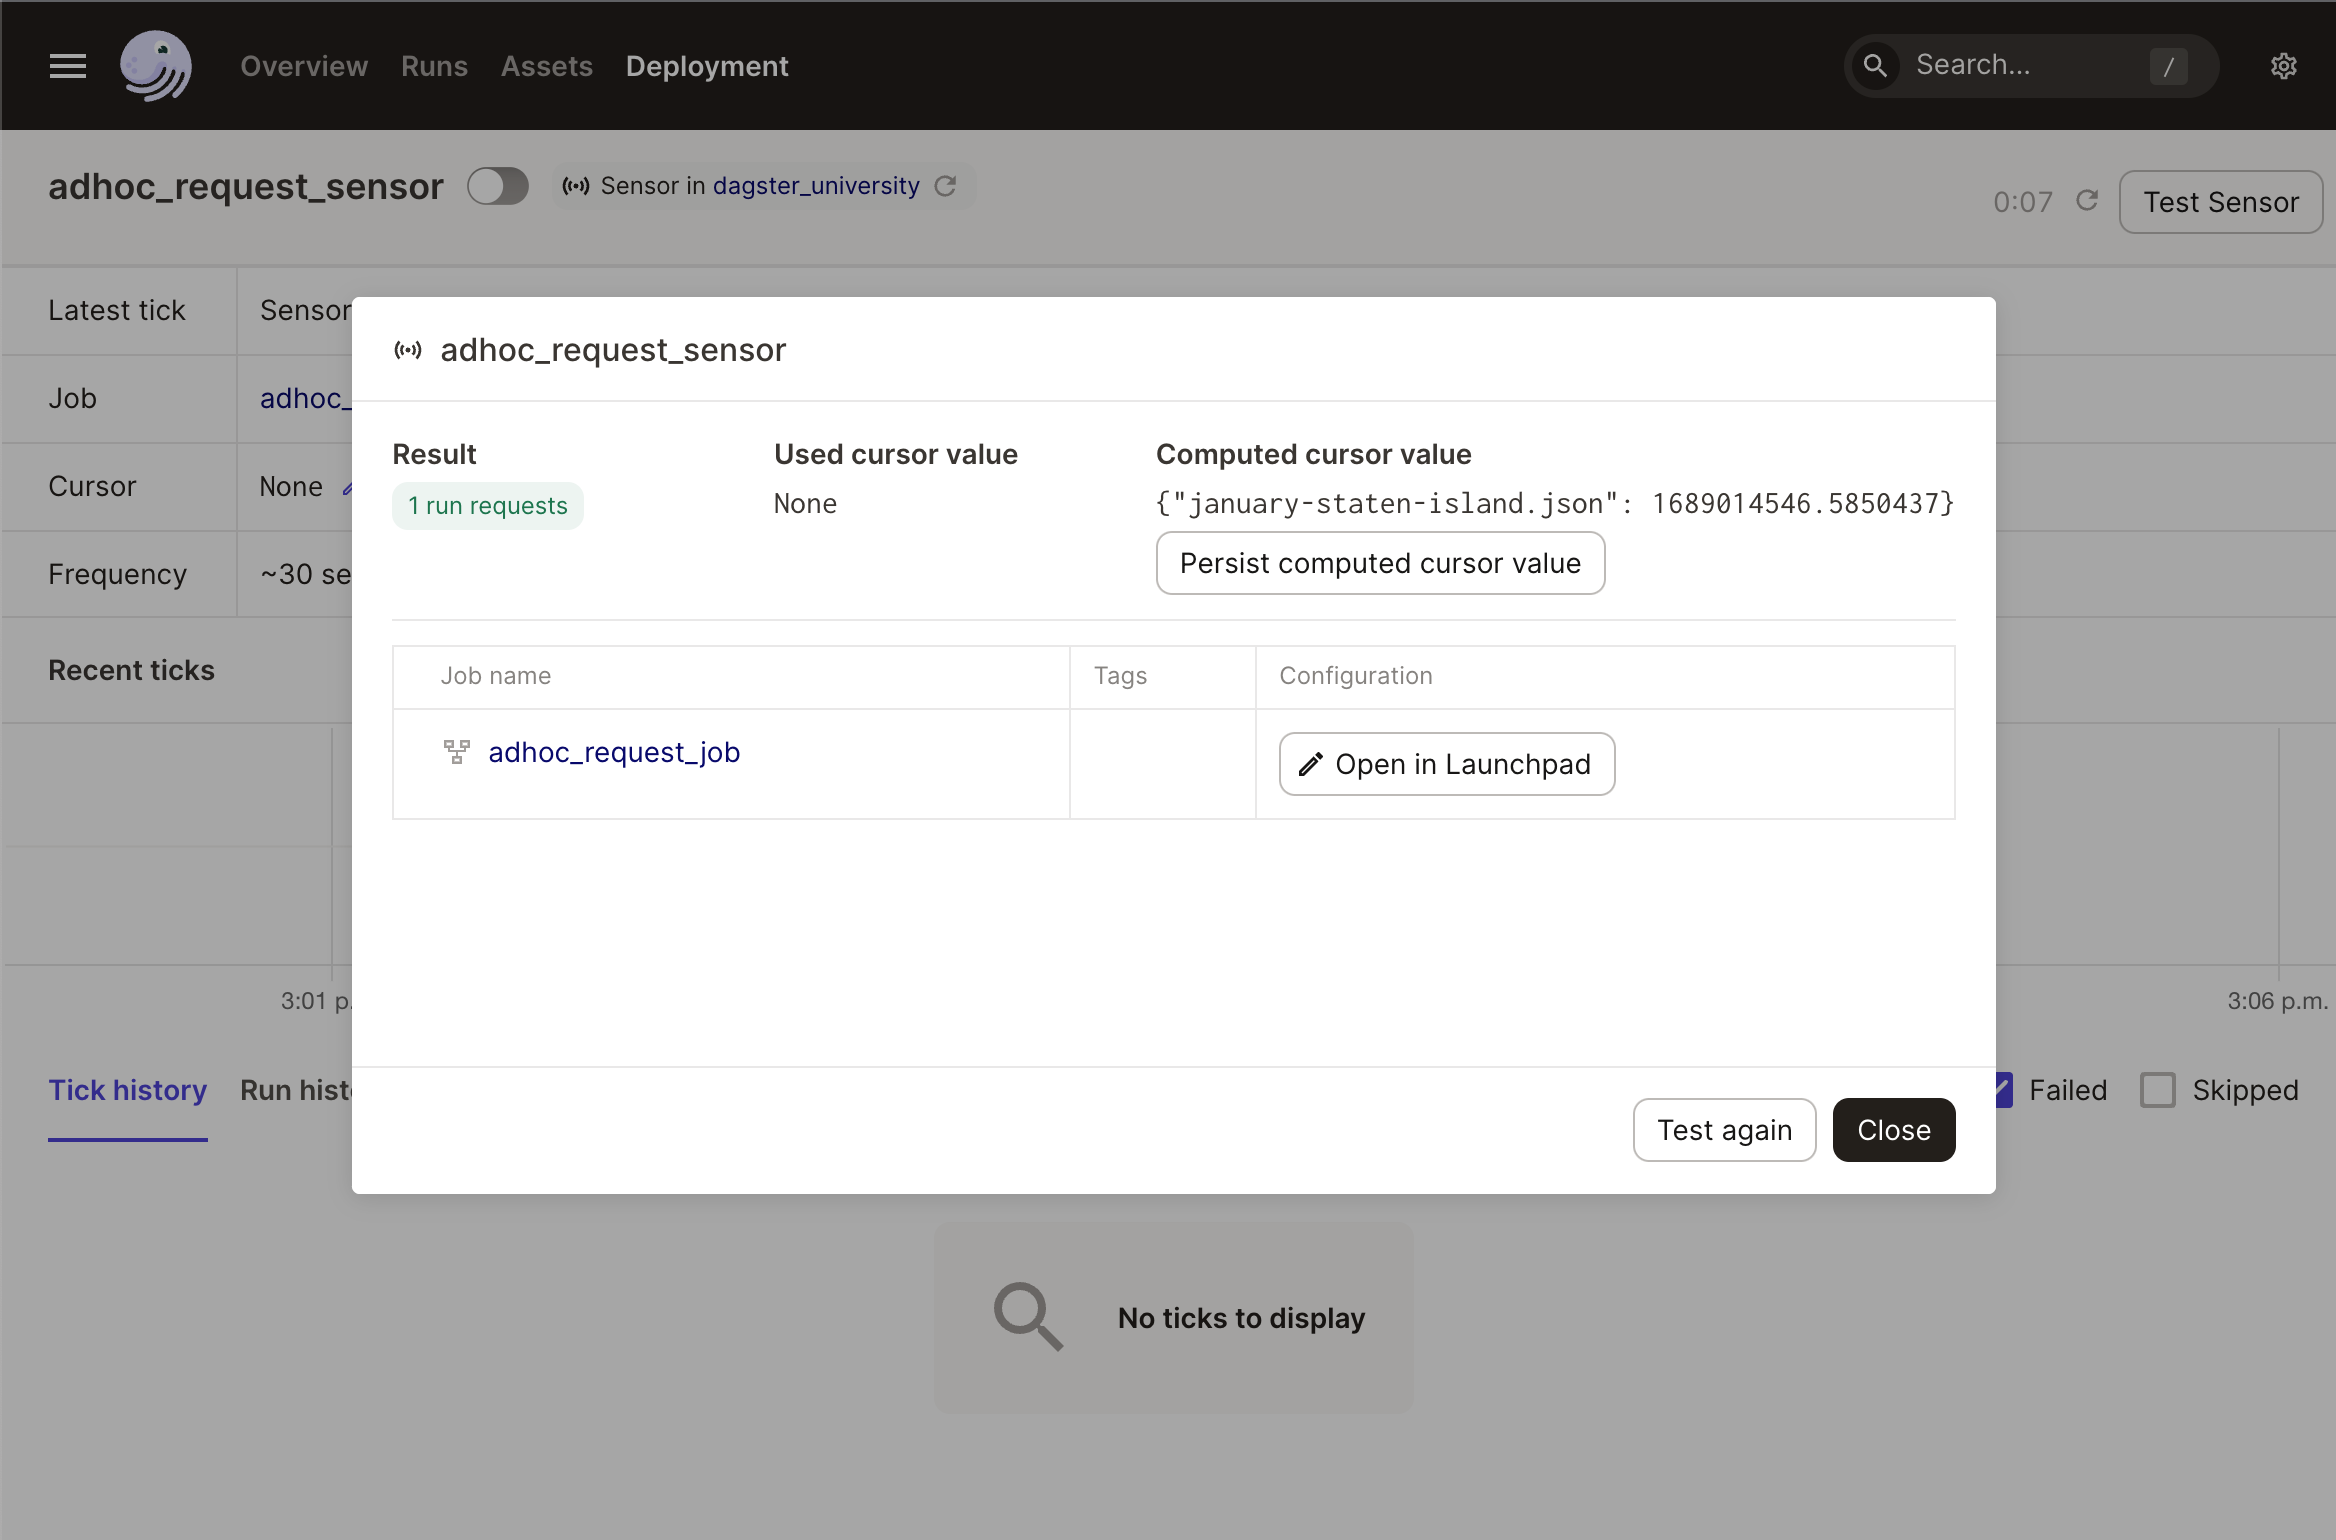
When the test completes, the results will display. Click the Open in Launchpad button to navigate to the adhoc_request_job.

Results from the sensor evaluation in the Dagster UI

Step four

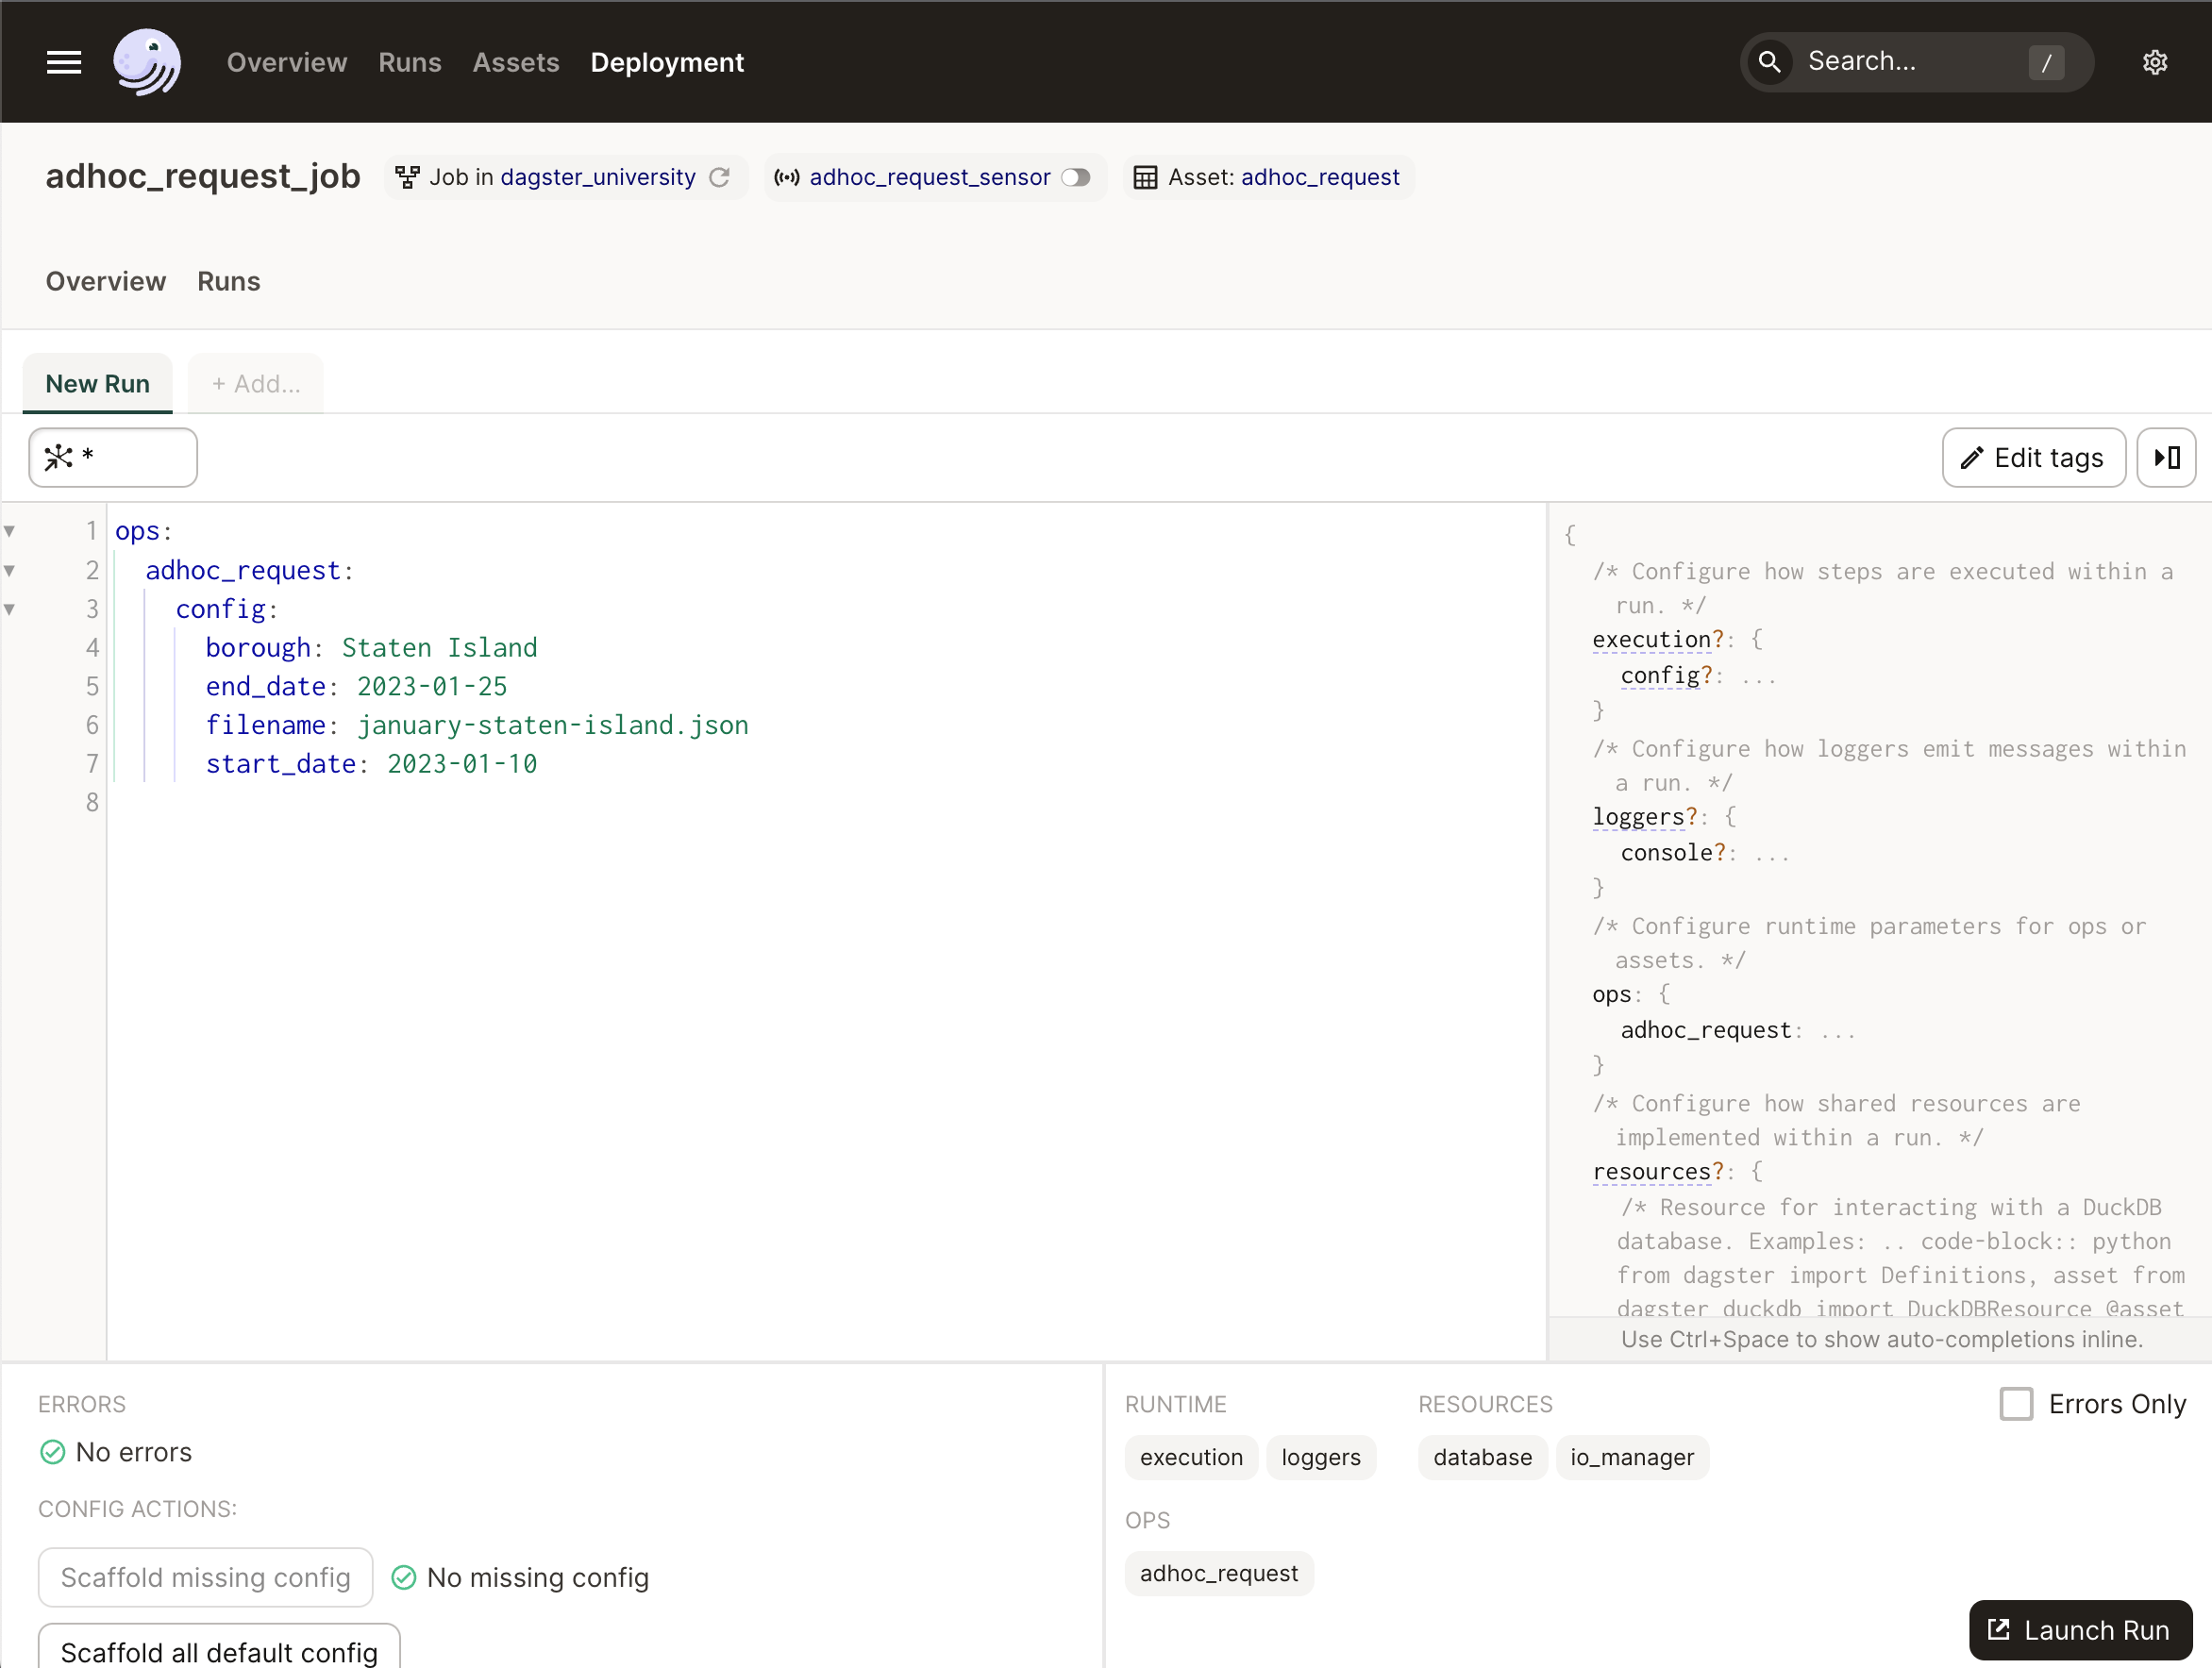
Notice how the launchpad has been pre-populated with the config from the january-staten-island.json file.

Click Launch Run at the bottom of the page to submit the run.

Pre-populated Launchpad for the adhoc_request_job job, using config from the january-staten-island.json file

Step five

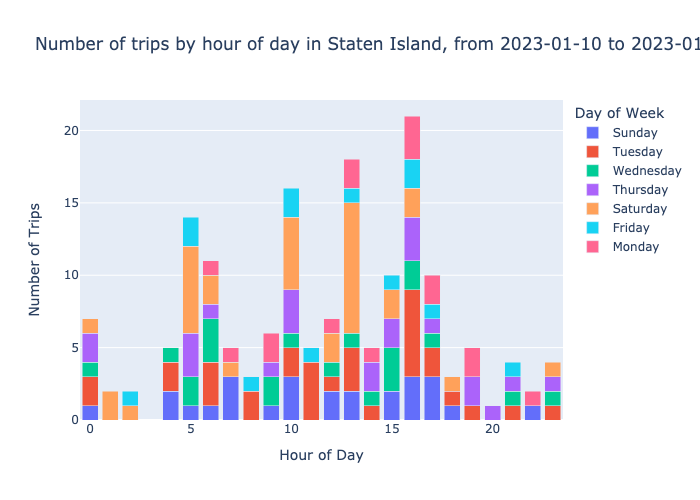
After the run completes, navigate to data/outputs in the project directory, where the asset saved the output file. You should see a bar chart like the one on the right.

Bar chart showing the number of trips by the hour of day in Staten Island in January 2023