Sensors in the Dagster UI
Now that the sensor is built, let's take a look around the Dagster UI.
| Step one | |
|---|---|
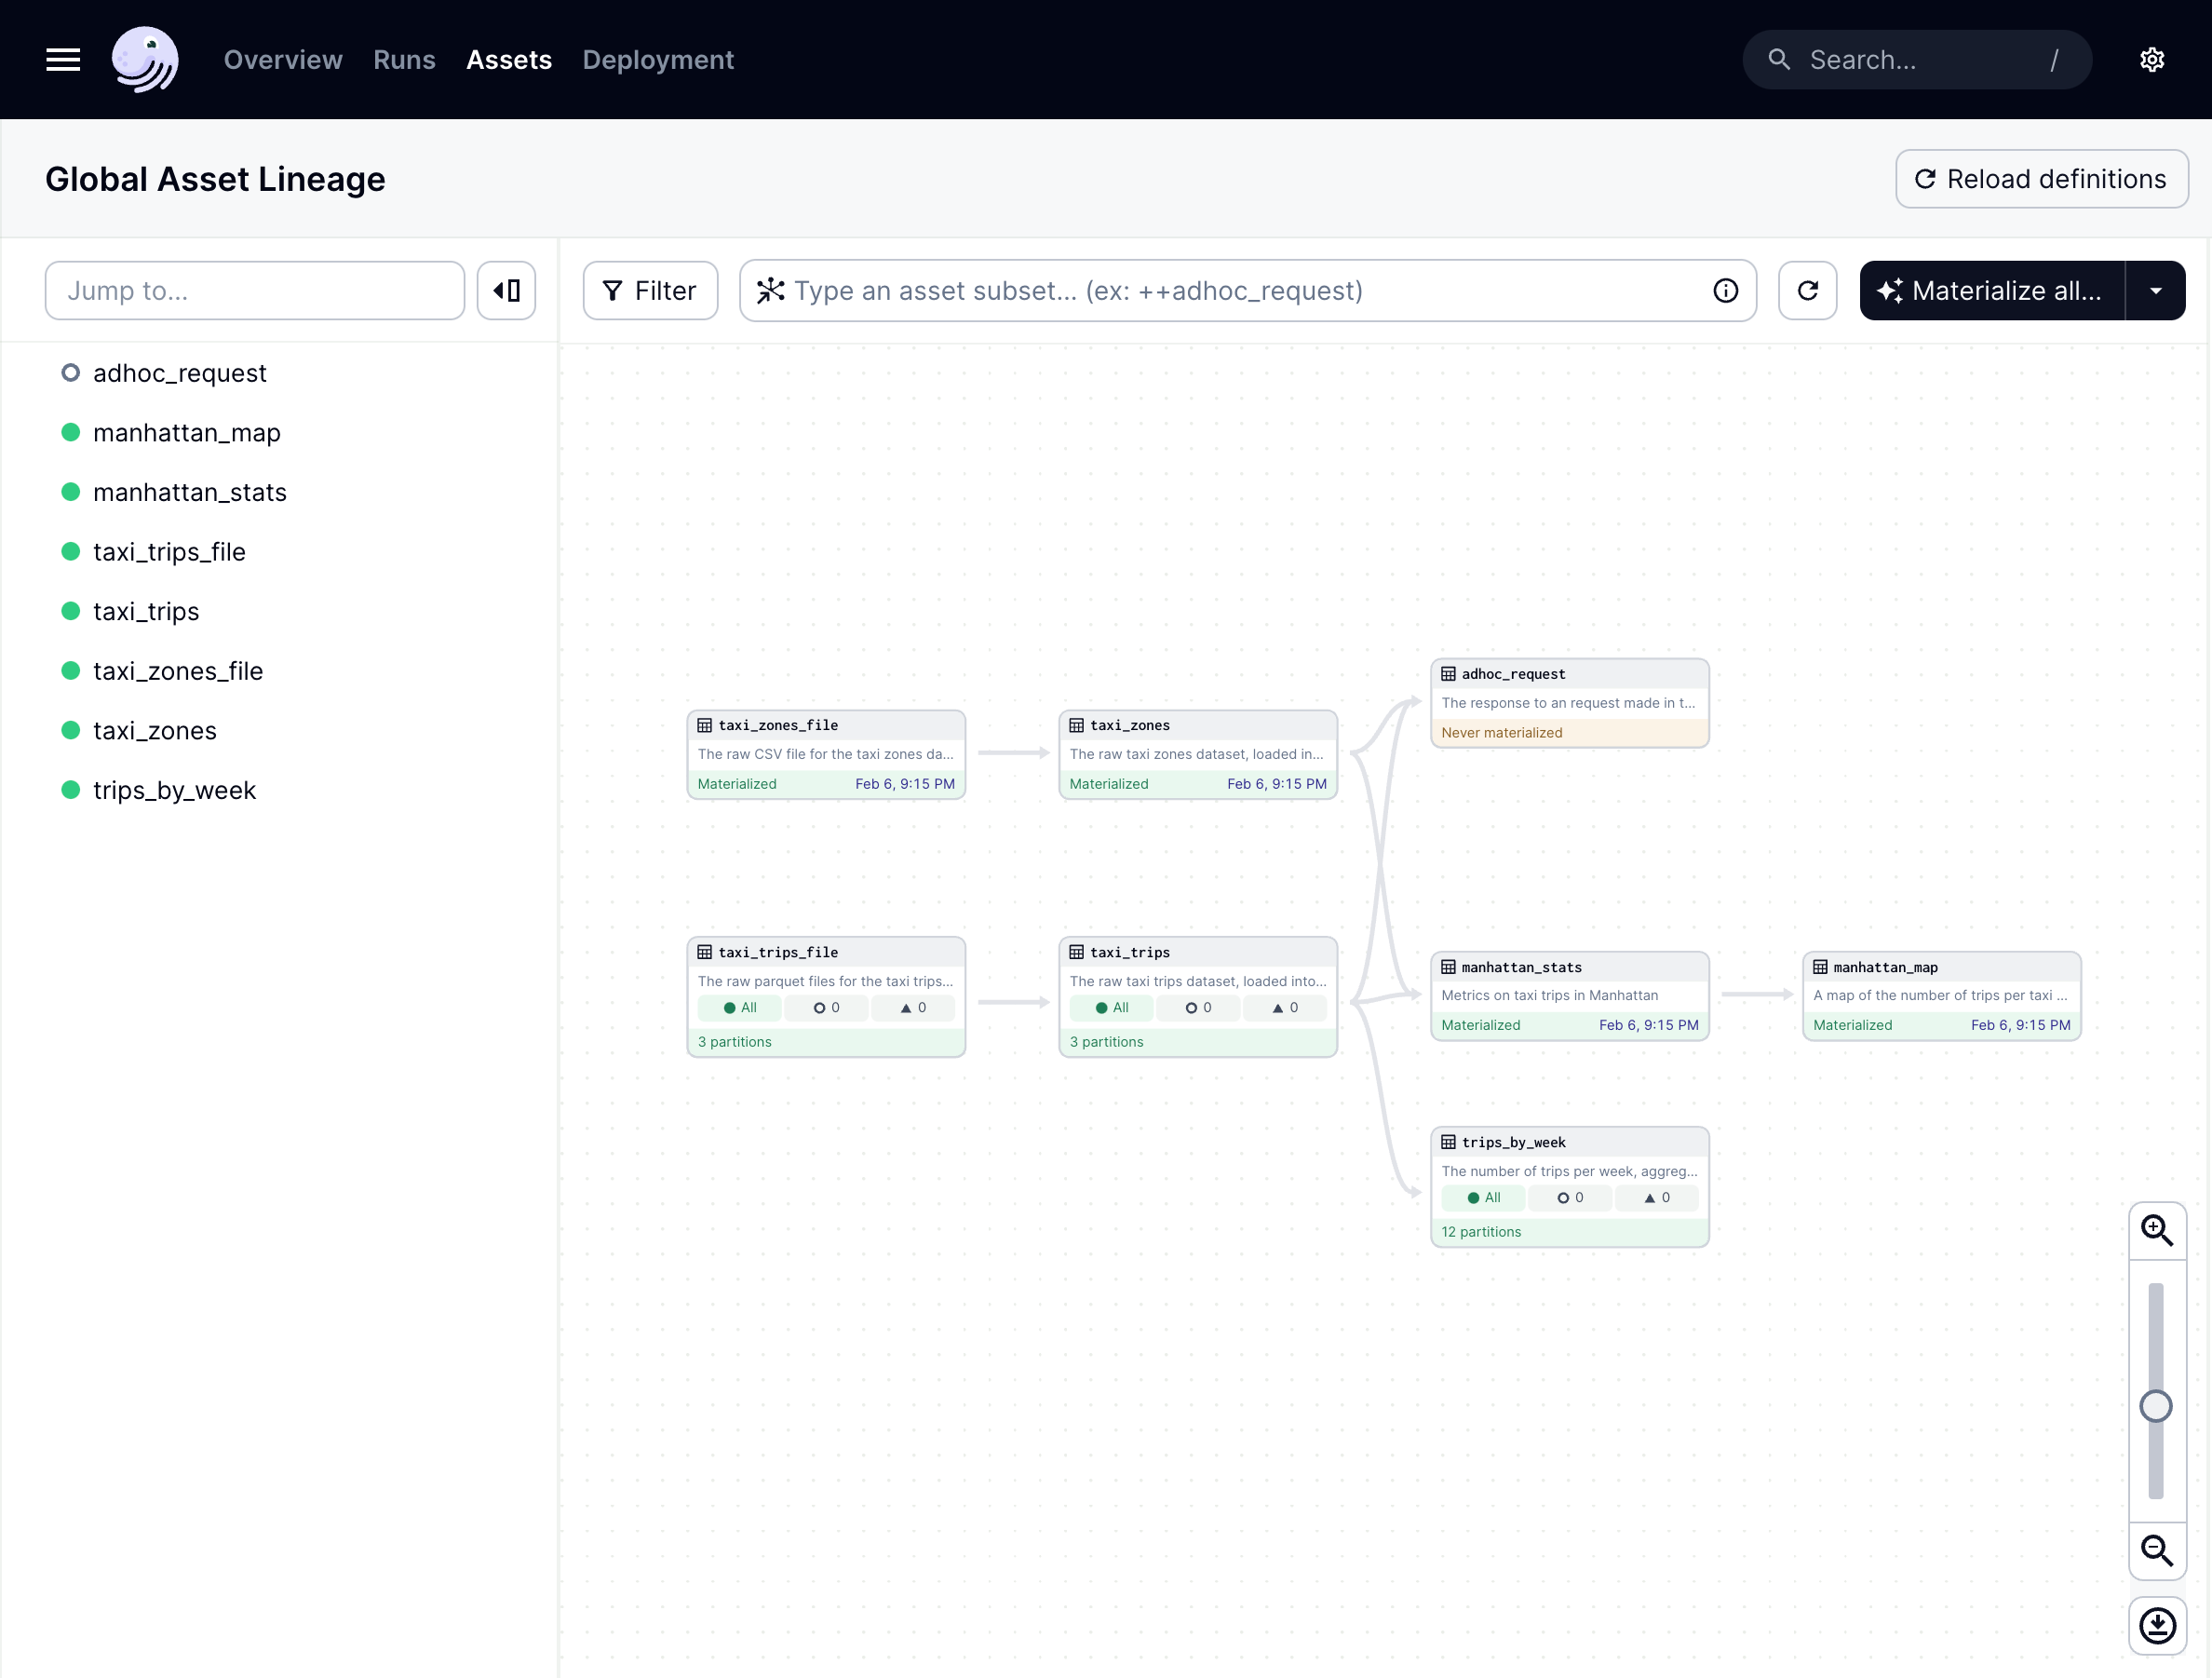
Navigate to the Global Asset Lineage page, where you should see the new asset, Note: If you don’t see the asset, click Reload definitions first. |
|
| Step two | |
|---|---|
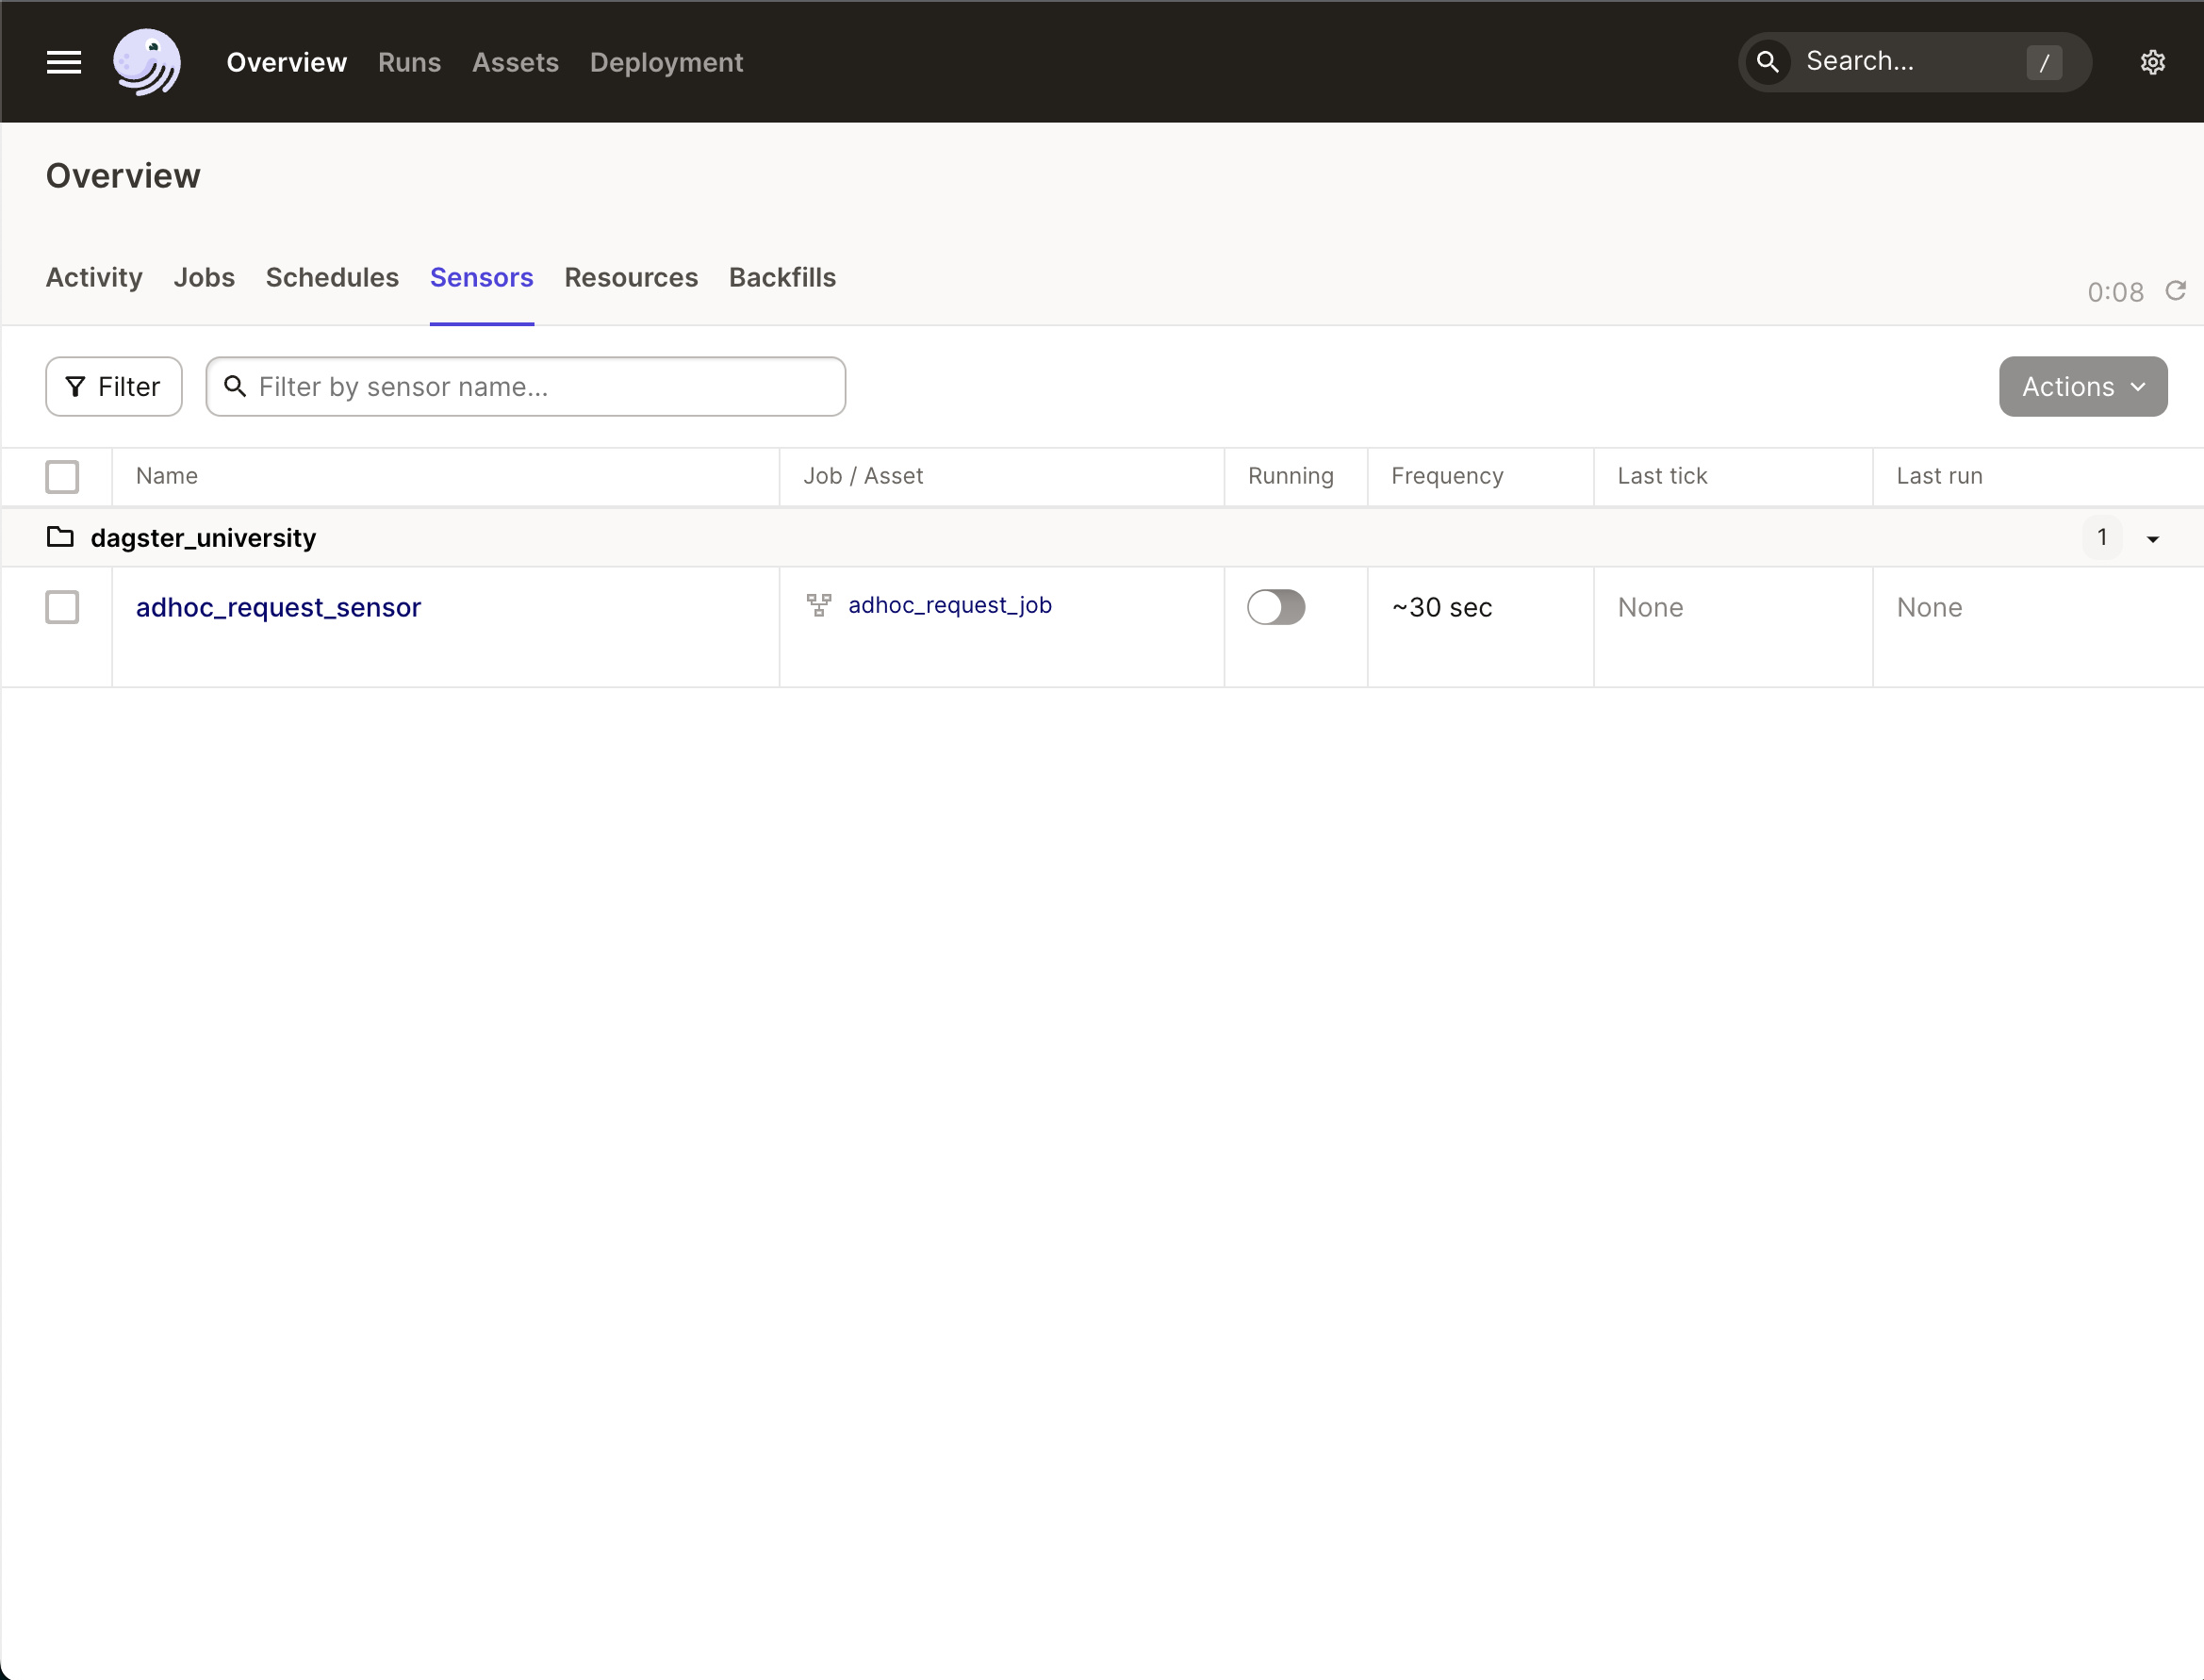
Click Overview > Sensors. In this tab, you’ll see the Notice that the Running toggle button has the sensor marked as turned off. By default, all sensors and schedules are off when first loaded. |
|
| Step three | |
|---|---|
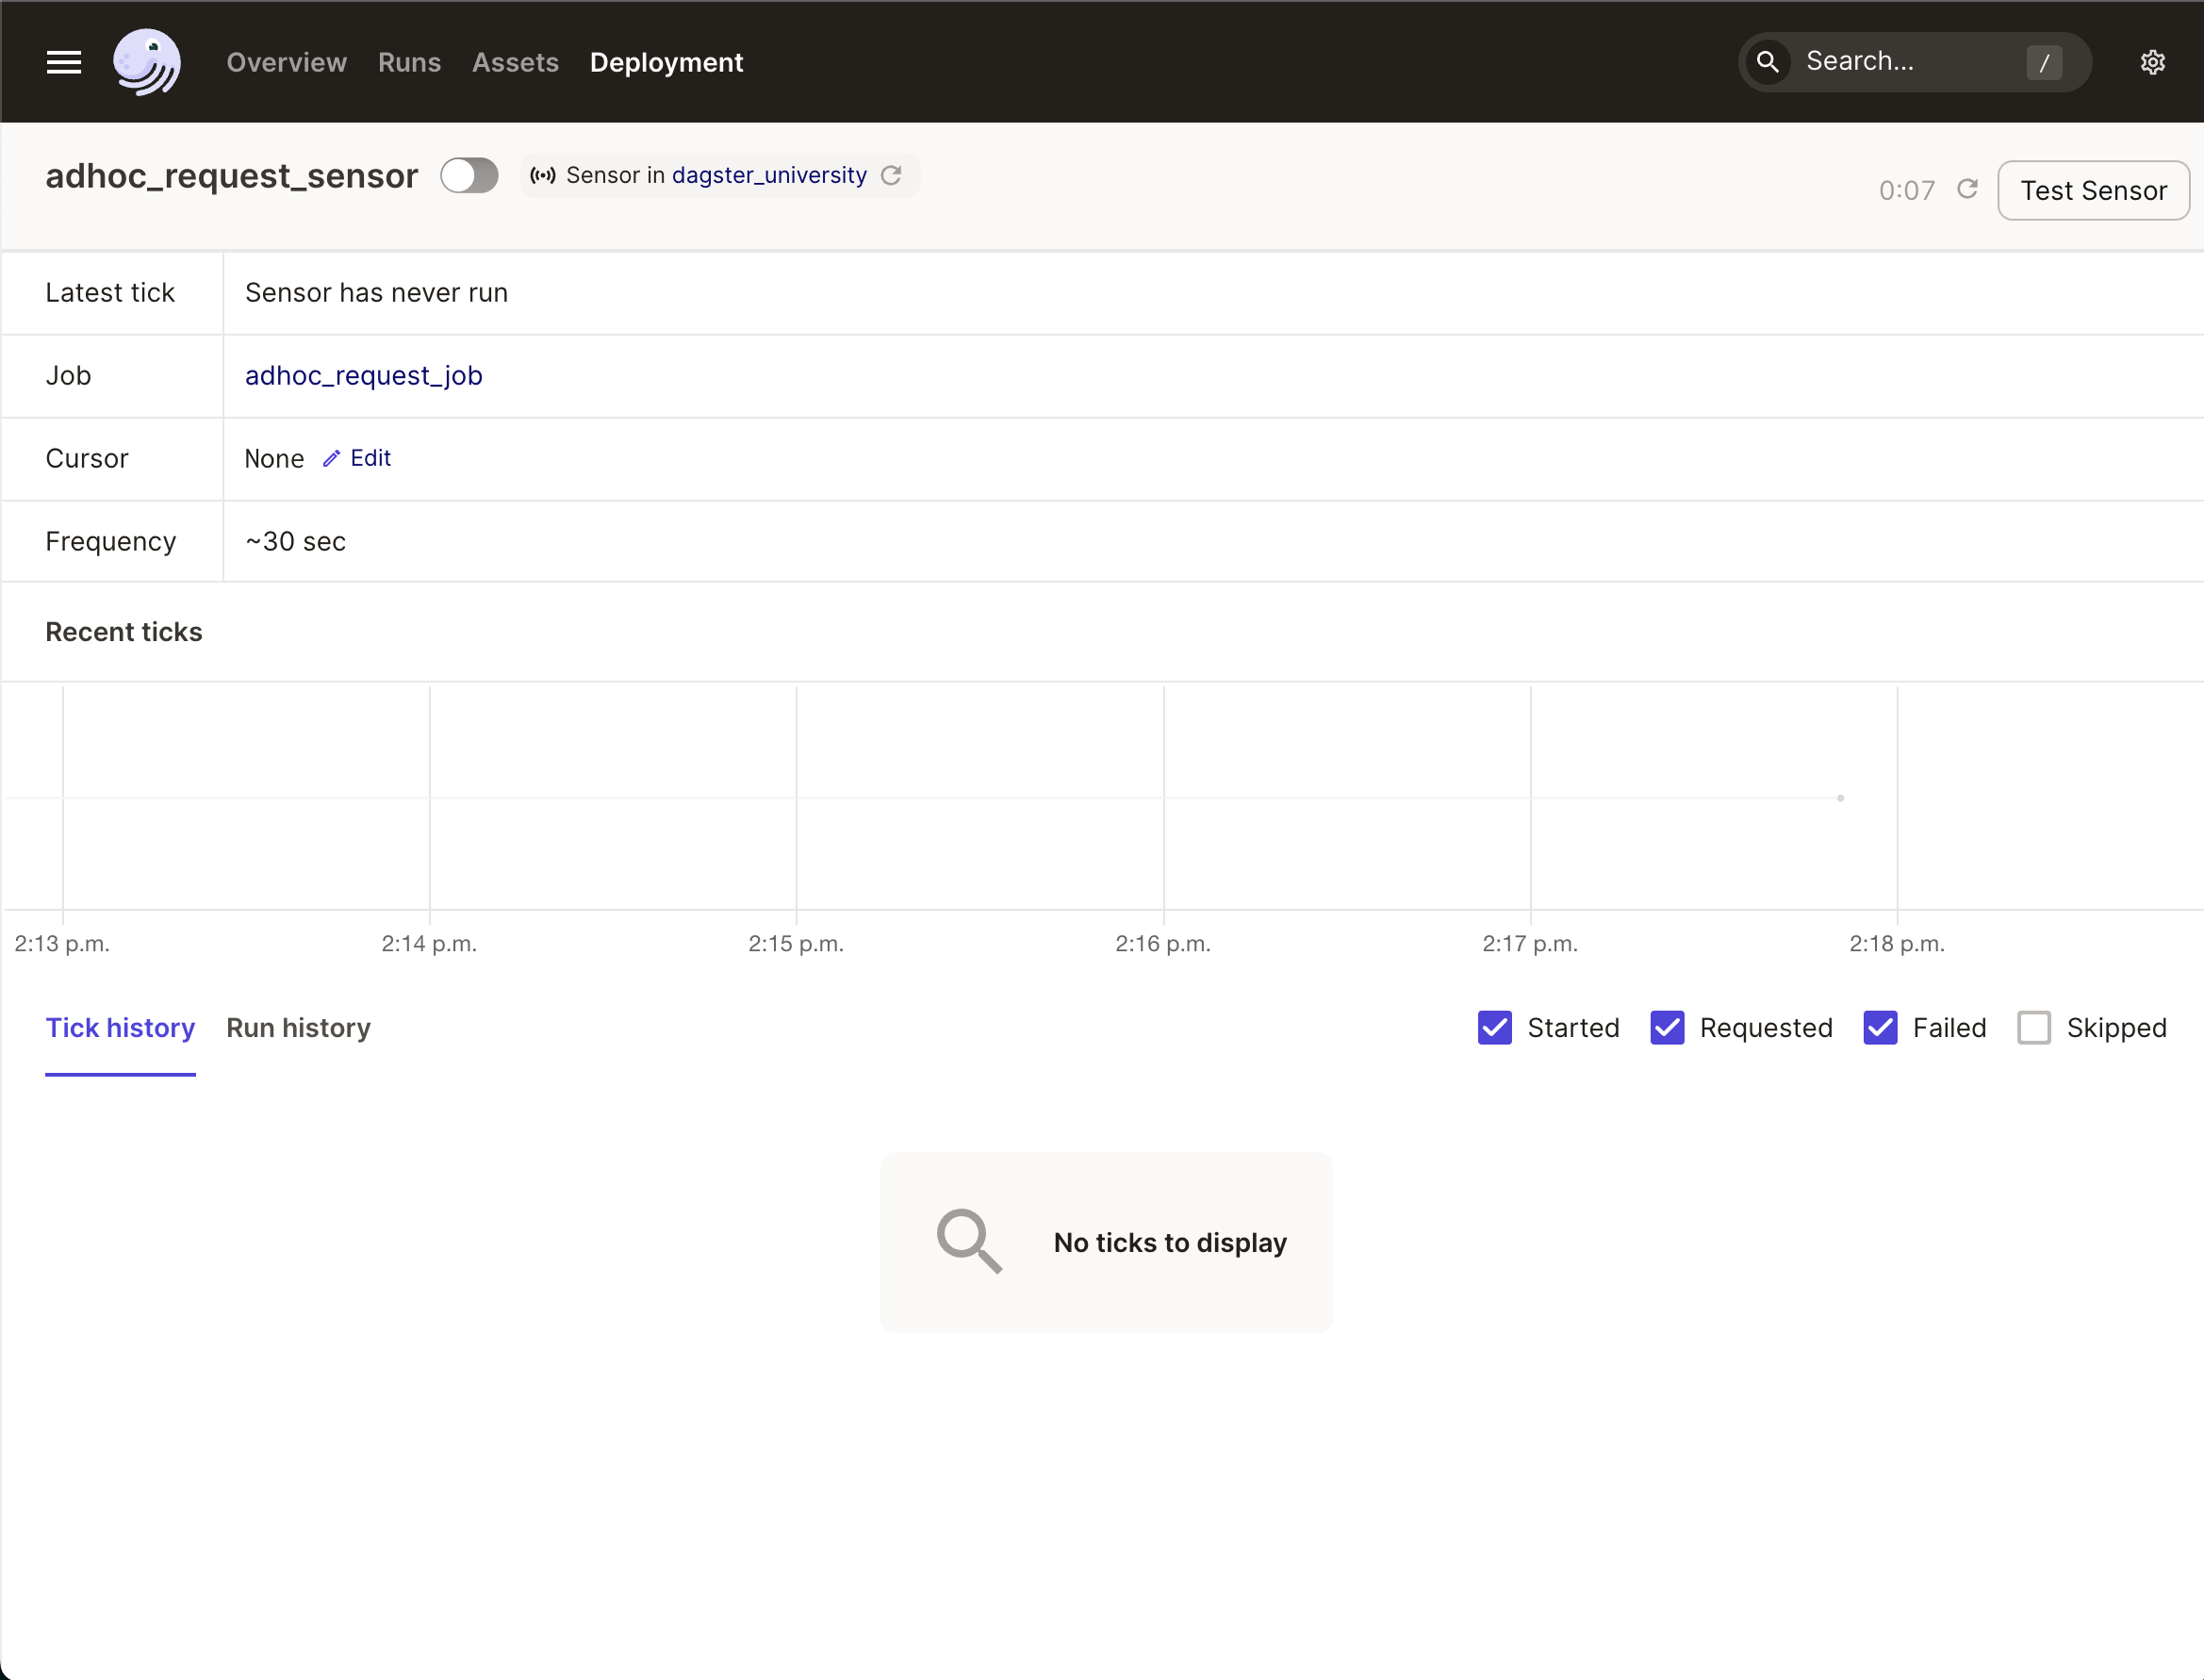
Click On this page, you’ll find detailed information about the sensor including the jobs that use it, its tick and run history, and more. |
|


